← back to field
← Back to portfolio

Modern Fortran · Gas turbine / CCGT · Second-law analysis · Self-initiated portfolio project

ThermoTwin-F — Gas Turbine and Combined-Cycle Digital Twin

Self-initiated educational simulator of a single-shaft gas turbine and combined-cycle (CCGT) extension, implemented in Modern Fortran 2008, with a native Win32/GDI+ operating console, a second-law analysis suite, and 28 passing native tests plus a physics selftest.

Reviewed 30 August 2026: fresh Windows CLI and GUI builds, 28 native tests plus the physics selftest, and 15 scenarios passed. Charts and numerical tables below are historical illustrations pending reproduction against the current source. They are not measured plant data or certification. Revamp 7 is an implementation milestone, not a tagged release. See the verification record and remaining work.

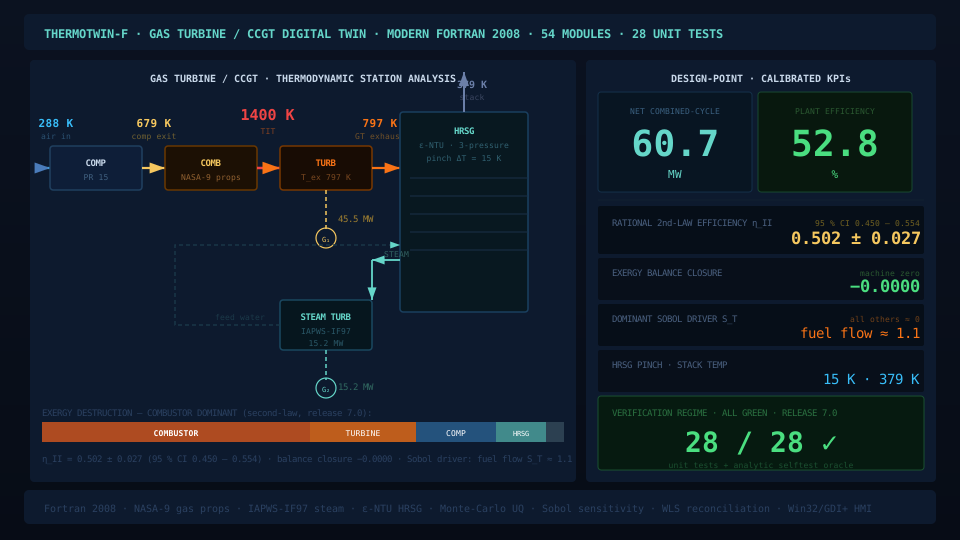
ThermoTwin-F CCGT station schematic: compressor, combustor, turbine, HRSG and steam turbine with design-point temperatures and KPIs

What this demonstrates

ThermoTwin-F is intended to evidence, in one artifact, the competencies a thermal-systems engineer or doctoral researcher should hold: thermodynamic rigour (closed mass/energy/exergy balances, named reference formulations, theoretical-limit benchmarking); numerical and software-engineering maturity (a clean modular architecture, an explicit dependency graph, a real test suite, deterministic reproducibility); uncertainty literacy (error bars and variance attribution rather than point estimates); and the ability to make complex systems legible through a designed, accessible operating console.

60.7 MW · 52.8 %Calibrated combined-cycle design point ηII = 0.50 ± 0.03Rational second-law efficiency, 95 % CI 28 unit tests — all greenCombustor dominance, Sobol isolation, χ² reconciliation 54 modules · one contractSingle GridState shared by every tier
Evidence dashboard

A twin that is understood, not just simulated.

Design question

How do you build a gas-turbine digital twin that is understood, not just simulated — with closed mass/energy/exergy balances, quantified uncertainty on every headline number, and an operating console that makes the physics legible?

54engine modules 28unit tests 16HMI screens

Design-point performance

Calibrated operating points

Quantity Simple cycle Combined cycle (calibrated)
Gas-turbine net power ≈30 MW 45.5 MW
Steam-turbine power — 15.2 MW
Plant net power ≈30 MW ≈60.7 MW
Thermal / plant efficiency ≈31 % 52.8 %
Heat rate ≈11,800 kJ/kWh —
Exhaust / stack temperature ≈797 K exhaust 379 K stack
HRSG pinch — 15 K

These values sit squarely within expected bands for an industrial single-shaft simple-cycle GT and a modern CCGT. The simple-cycle point is verified against an independent hand calculation (thermotwin selftest); the combined-cycle point is calibrated.

Second-law analysis

Historical exergy examples (Revamp 7)

Exported from the running console (shift_data_t27.csv, [SCIENTIFIC_ANALYSIS] block). All figures carry a balance-closure residual or a confidence interval; none are asserted without a stated method.

Metric Value
Rational efficiency ηII 0.500
ηII with Monte-Carlo UQ 0.502 ± 0.027  (95 % CI 0.450–0.554)
Dominant irreversibility Combustor — largest exergy destruction component
Exergy-balance closure residual −0.0000 (machine zero)
Dominant Sobol driver of ηII Fuel flow  (ST ≈ 1.1, all others ≈ 0)

The closed balance, combustor dominance, and clean single-driver Sobol decomposition are exactly what second-law theory predicts for this plant class — the analysis reproduces known physics rather than asserting numbers.

Analysis plots

Six simulation studies — design point to uncertainty.

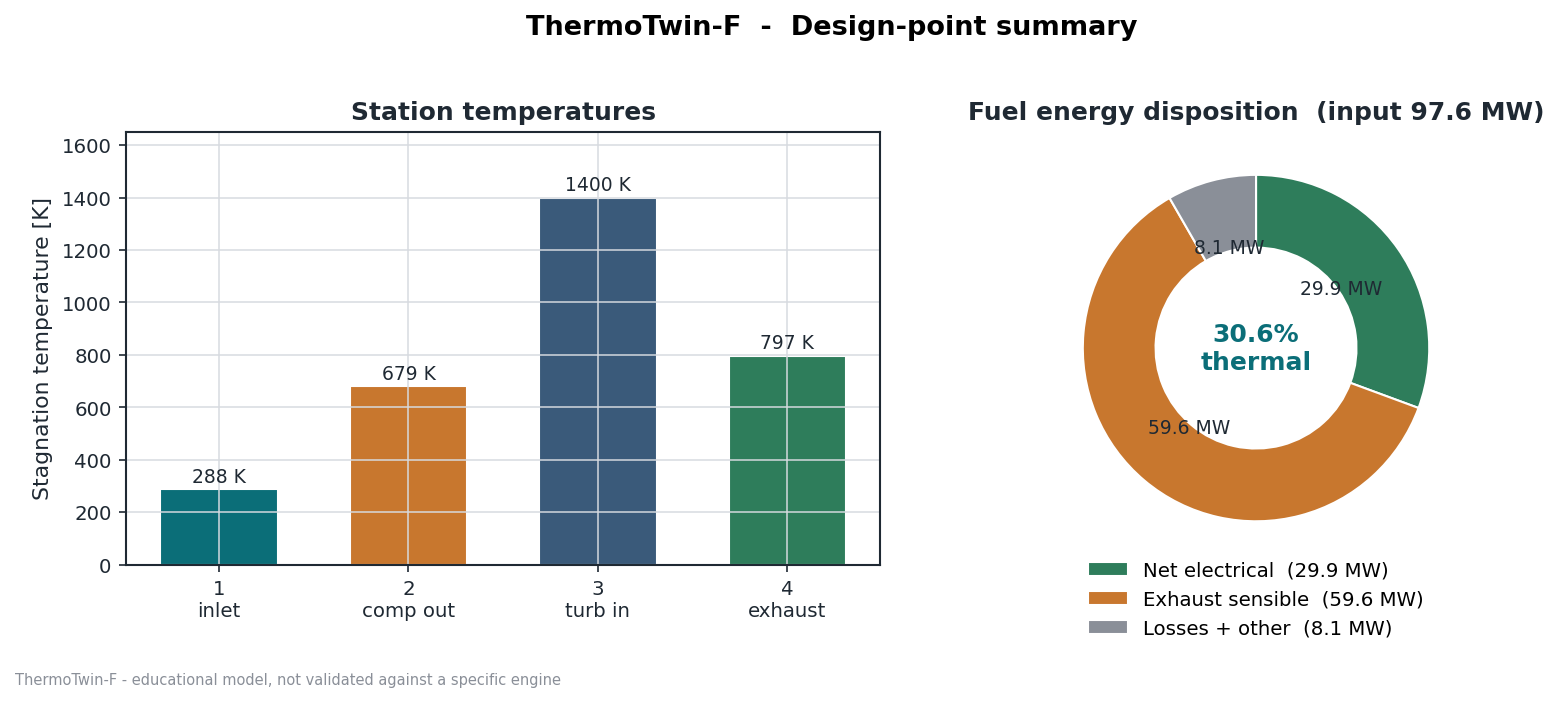
ThermoTwin-F design-point: station temperatures bar chart and fuel-energy disposition donut
01 / Design-point thermodynamic stateStation temperature breakdown from compressor inlet (288 K) through TIT (1400 K) to HRSG exhaust, paired with fuel-energy disposition: net electrical 29.9 MW, exhaust sensible 59.6 MW, losses 8.1 MW — the donut is the input for combined-cycle HRSG sizing.
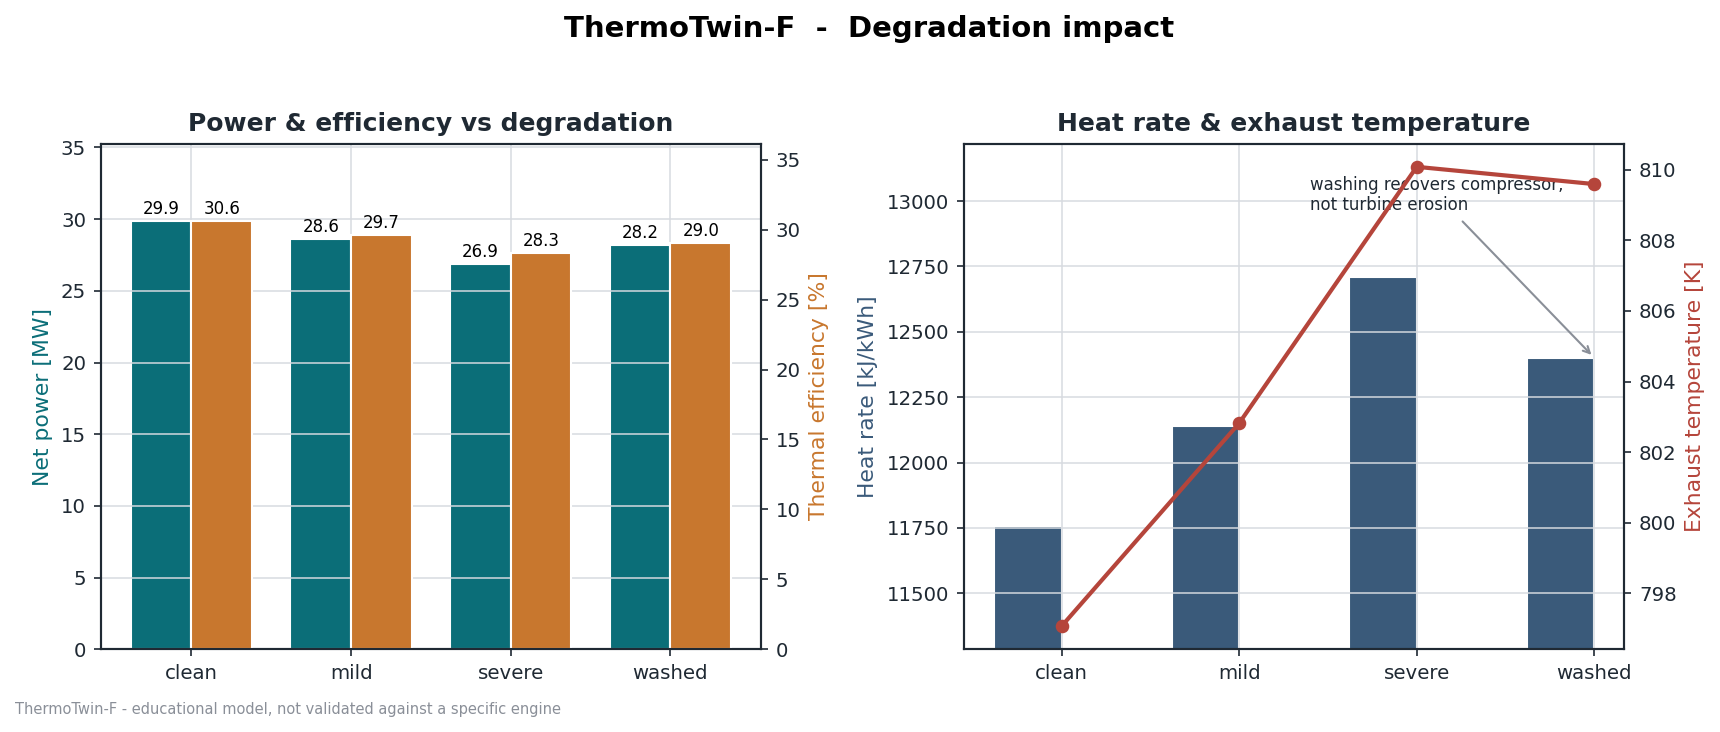
ThermoTwin-F degradation study: net power and heat rate vs degradation state
02 / Degradation and compressor washingNet power drops from 29.9 MW (clean) to 26.9 MW (severe fouling); washing recovers to 28.2 MW. Heat rate and exhaust temperature rise monotonically with fouling — washing recovers compressor isentropic efficiency, not turbine erosion.
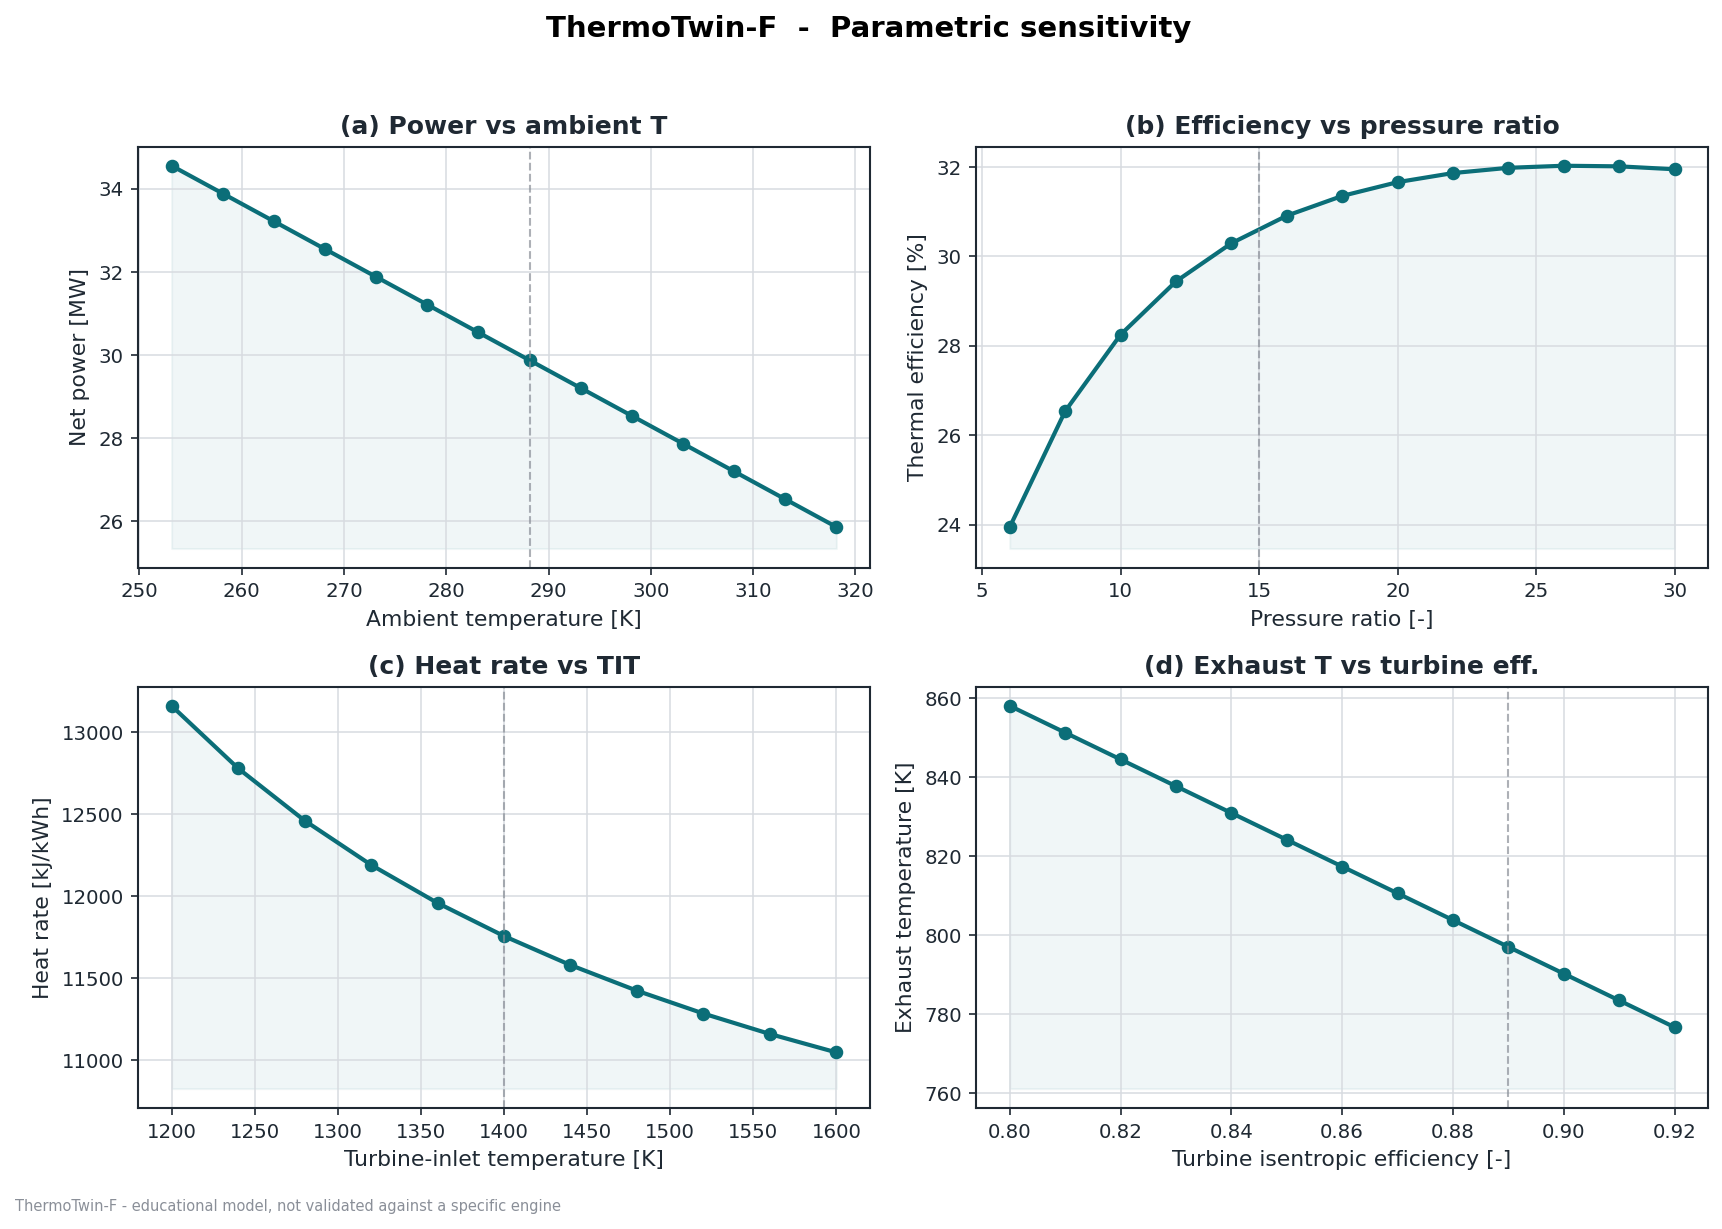
ThermoTwin-F parametric sensitivity: four one-at-a-time sweeps
03 / Parametric sensitivity (simple cycle)Four one-at-a-time sweeps: net power vs ambient temperature (250–320 K); thermal efficiency vs pressure ratio (5–30); heat rate vs TIT (1200–1600 K); exhaust temperature vs turbine isentropic efficiency (0.80–0.92). Outputs span the full site-condition and design-parameter envelope.
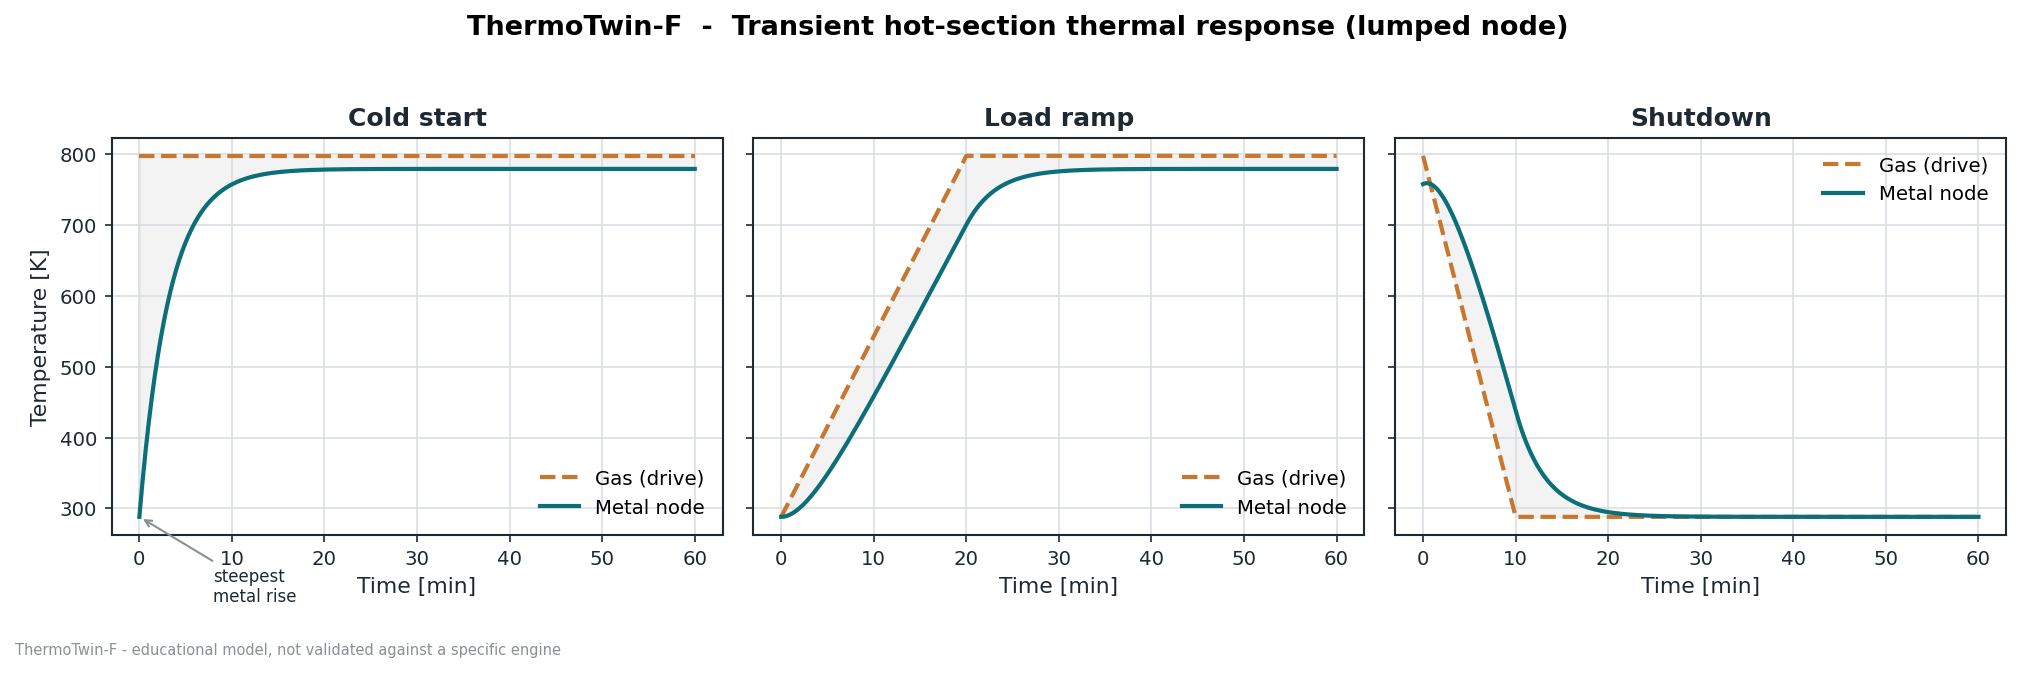
ThermoTwin-F transient hot-section thermal response: cold start, load ramp and shutdown
04 / Transient hot-section thermal responseLumped-node metal temperature vs gas-path drive signal for three transients. Steepest metal rise occurs in the first 10 min of cold start. Load ramp shows the gas leading the metal by several minutes. Shutdown gas path cools instantly; metal lags by ~20 min.
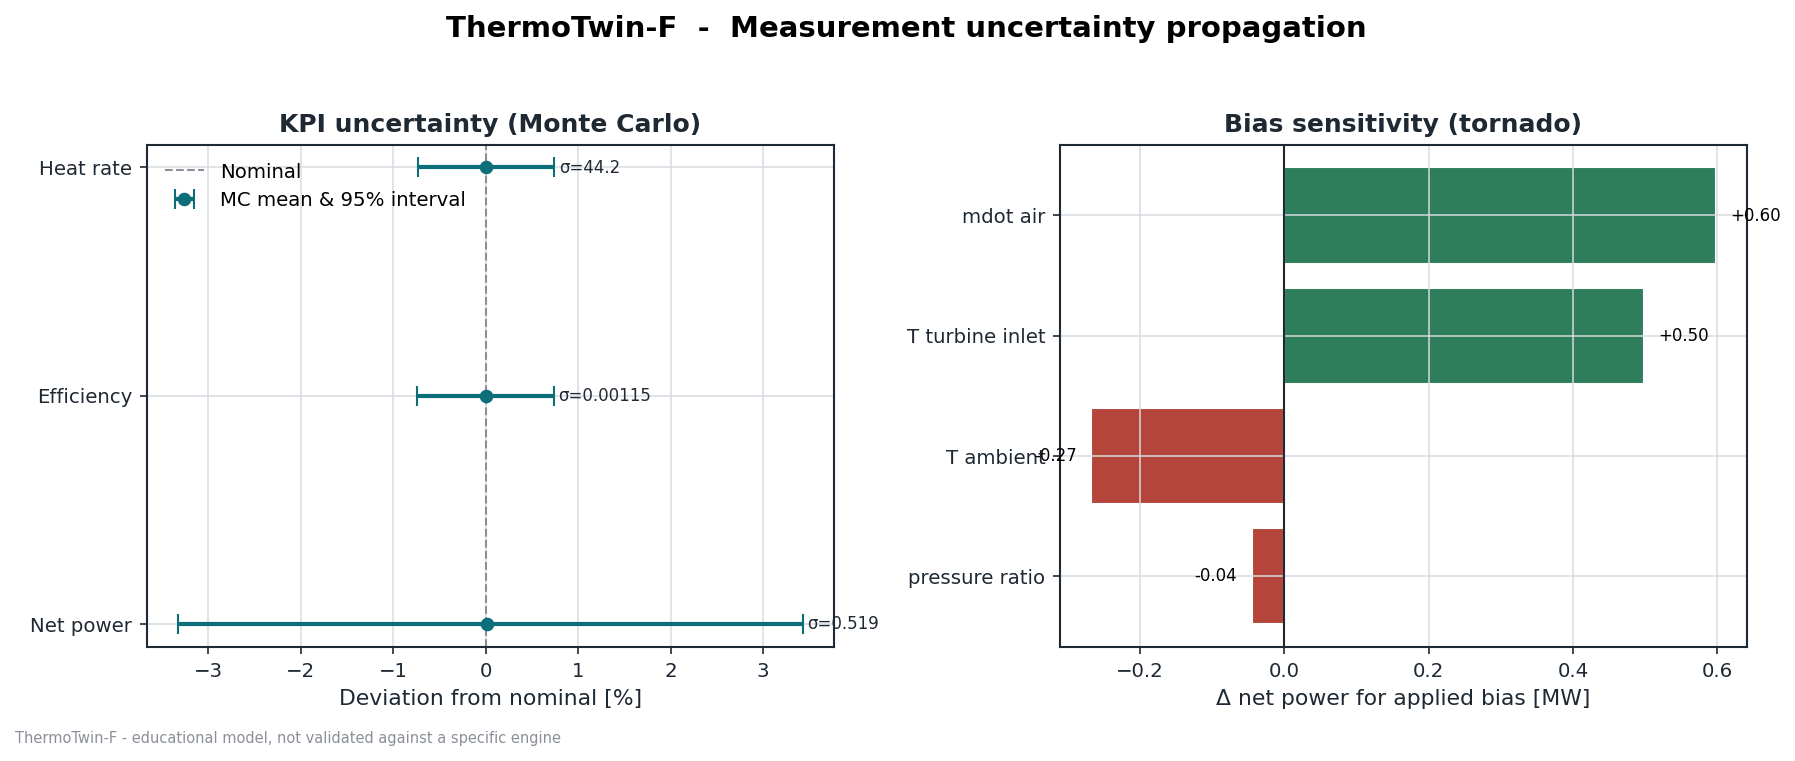
ThermoTwin-F measurement uncertainty propagation: Monte Carlo KPI intervals and bias-sensitivity tornado
05 / Measurement uncertainty propagationLeft: Monte-Carlo KPI uncertainty — net power σ = 0.519 %, efficiency σ = 0.00115, heat rate σ = 44.2 kJ/kWh, all symmetric about nominal. Right: Bias-sensitivity tornado — mdot_air (+0.60 MW) and T_turbine_inlet (+0.50 MW) dominate; pressure ratio biases net power by only −0.04 MW.
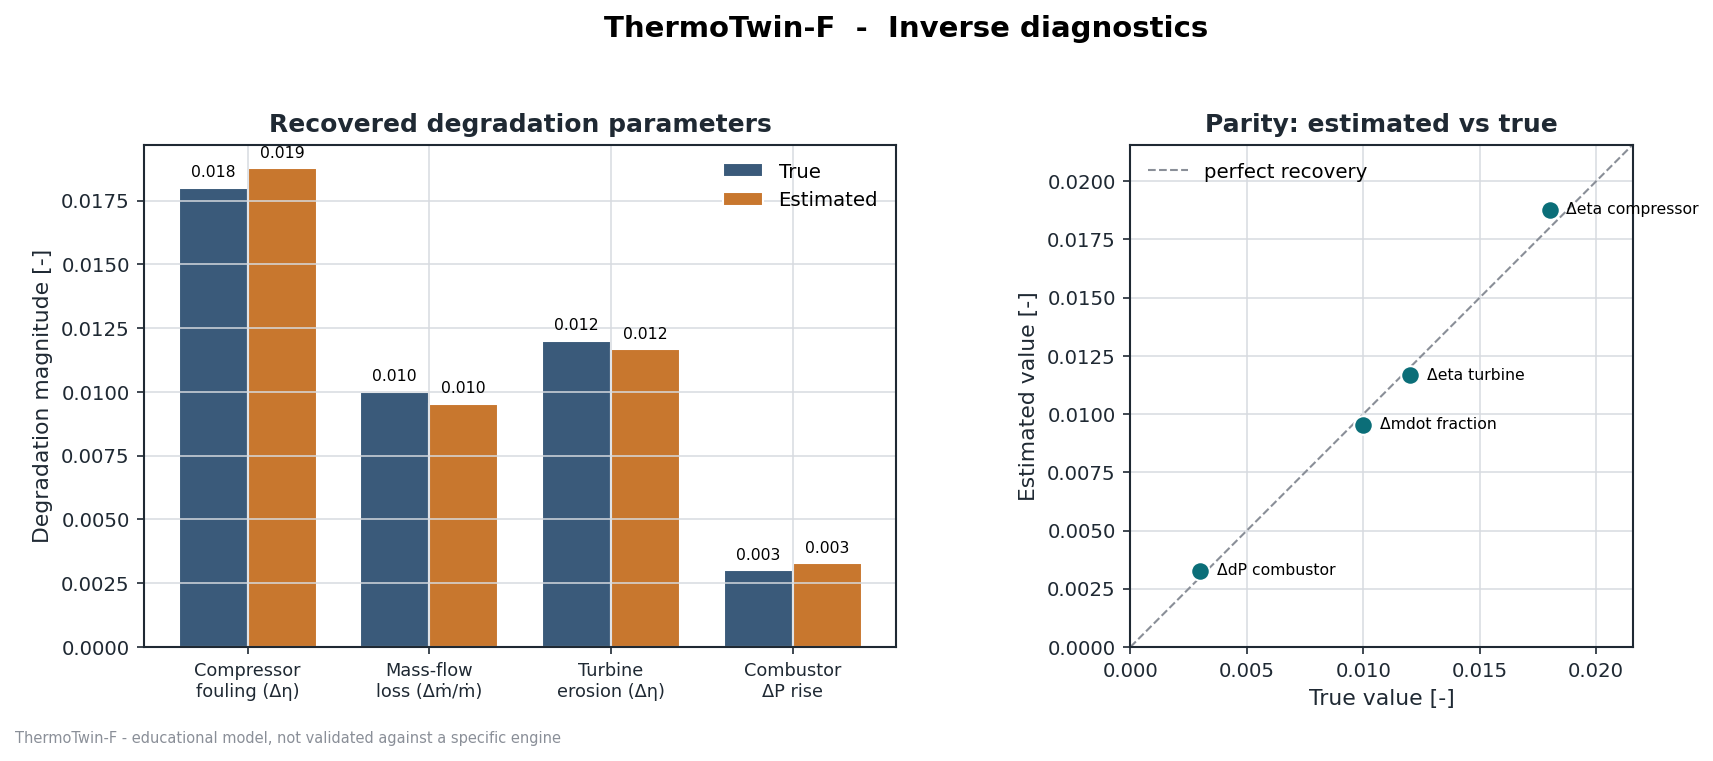
ThermoTwin-F inverse diagnostics: recovered degradation parameters vs true values and parity plot
06 / Inverse diagnostics recoveryThe inverse solver recovers four injected degradation parameters (compressor fouling Δη, mass-flow loss Δṁ/ṁ, turbine erosion Δη, combustor ΔP rise) from simulated sensor observations. The parity plot confirms near-perfect alignment with the true values on all four parameters.

Operating console

Native Win32/GDI+ HMI — 16 analysis screens.

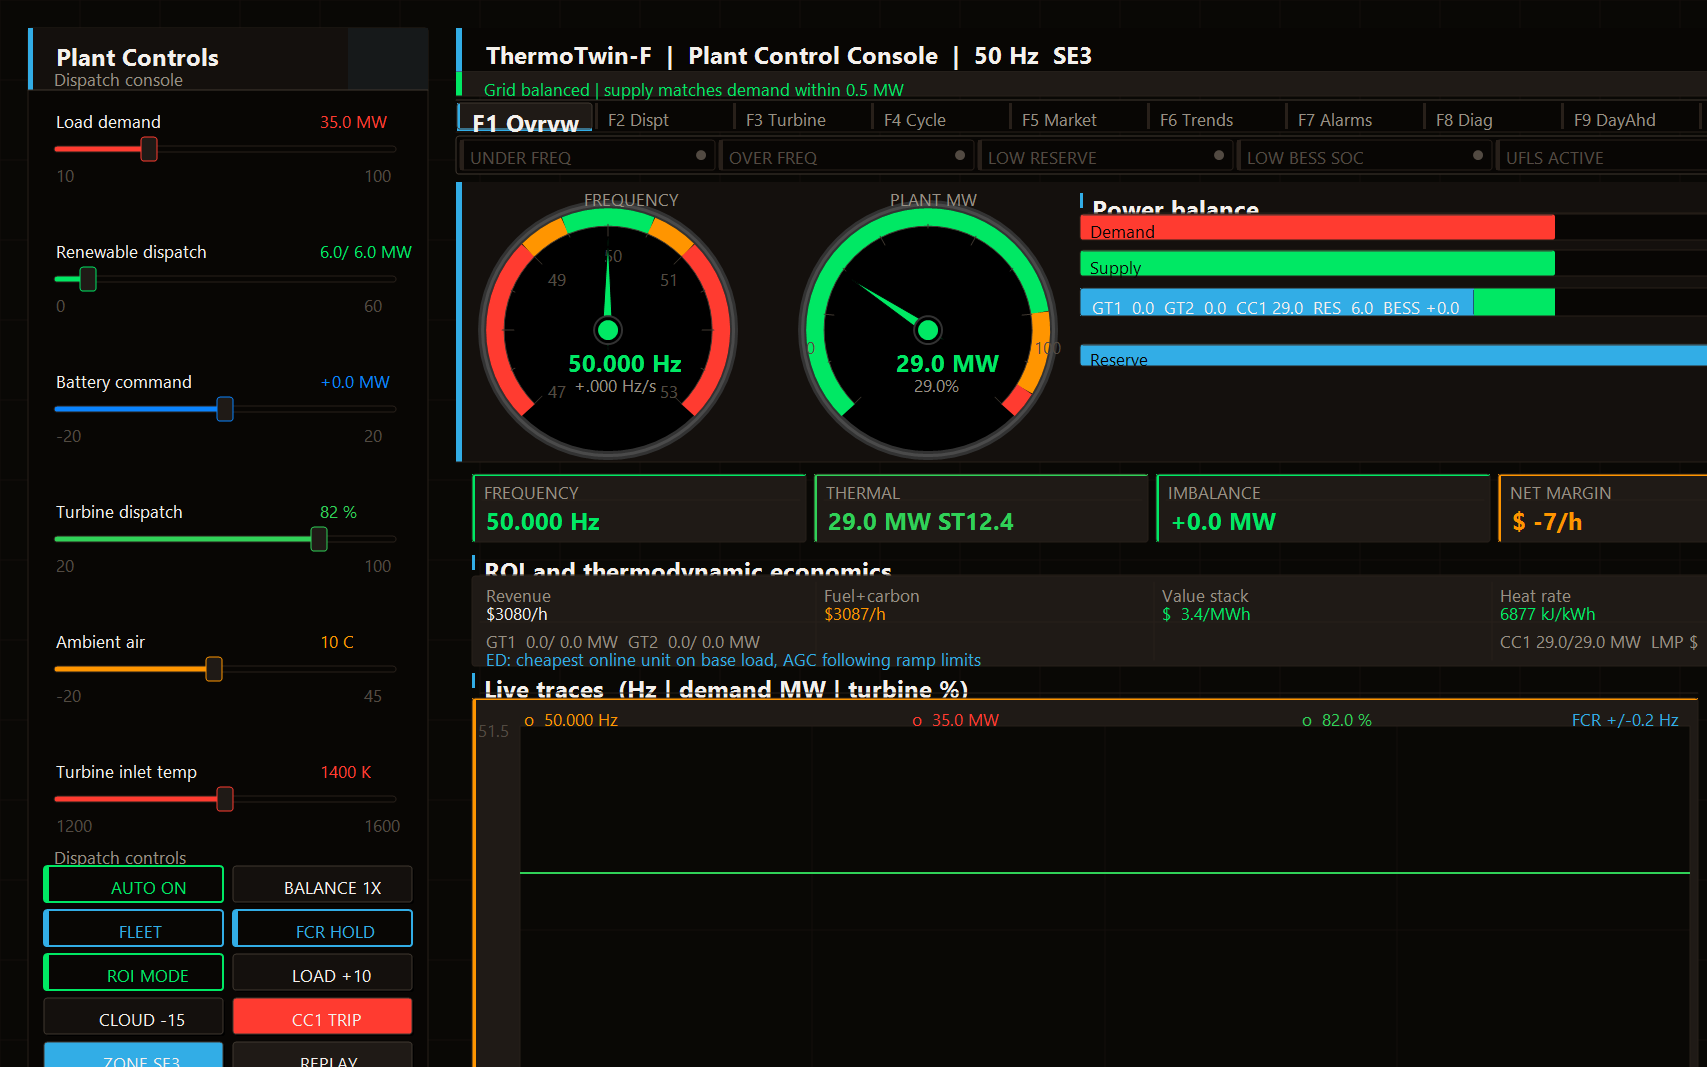
ThermoTwin-F HMI F1 Plant Control Console — overview screen with frequency gauge, power-balance bar and dispatch controls
F1 / Plant Control ConsoleFlagship overview screen: real-time frequency gauge (50.000 Hz), plant-MW dial (29.0 MW), live power-balance bar (demand / supply / reserve), and ROI economics strip showing revenue $3080/h, fuel+carbon $3087/h, value stack $3.4/MWh. The left console exposes load demand, renewable dispatch, battery command, TIT set point and scene-control buttons.
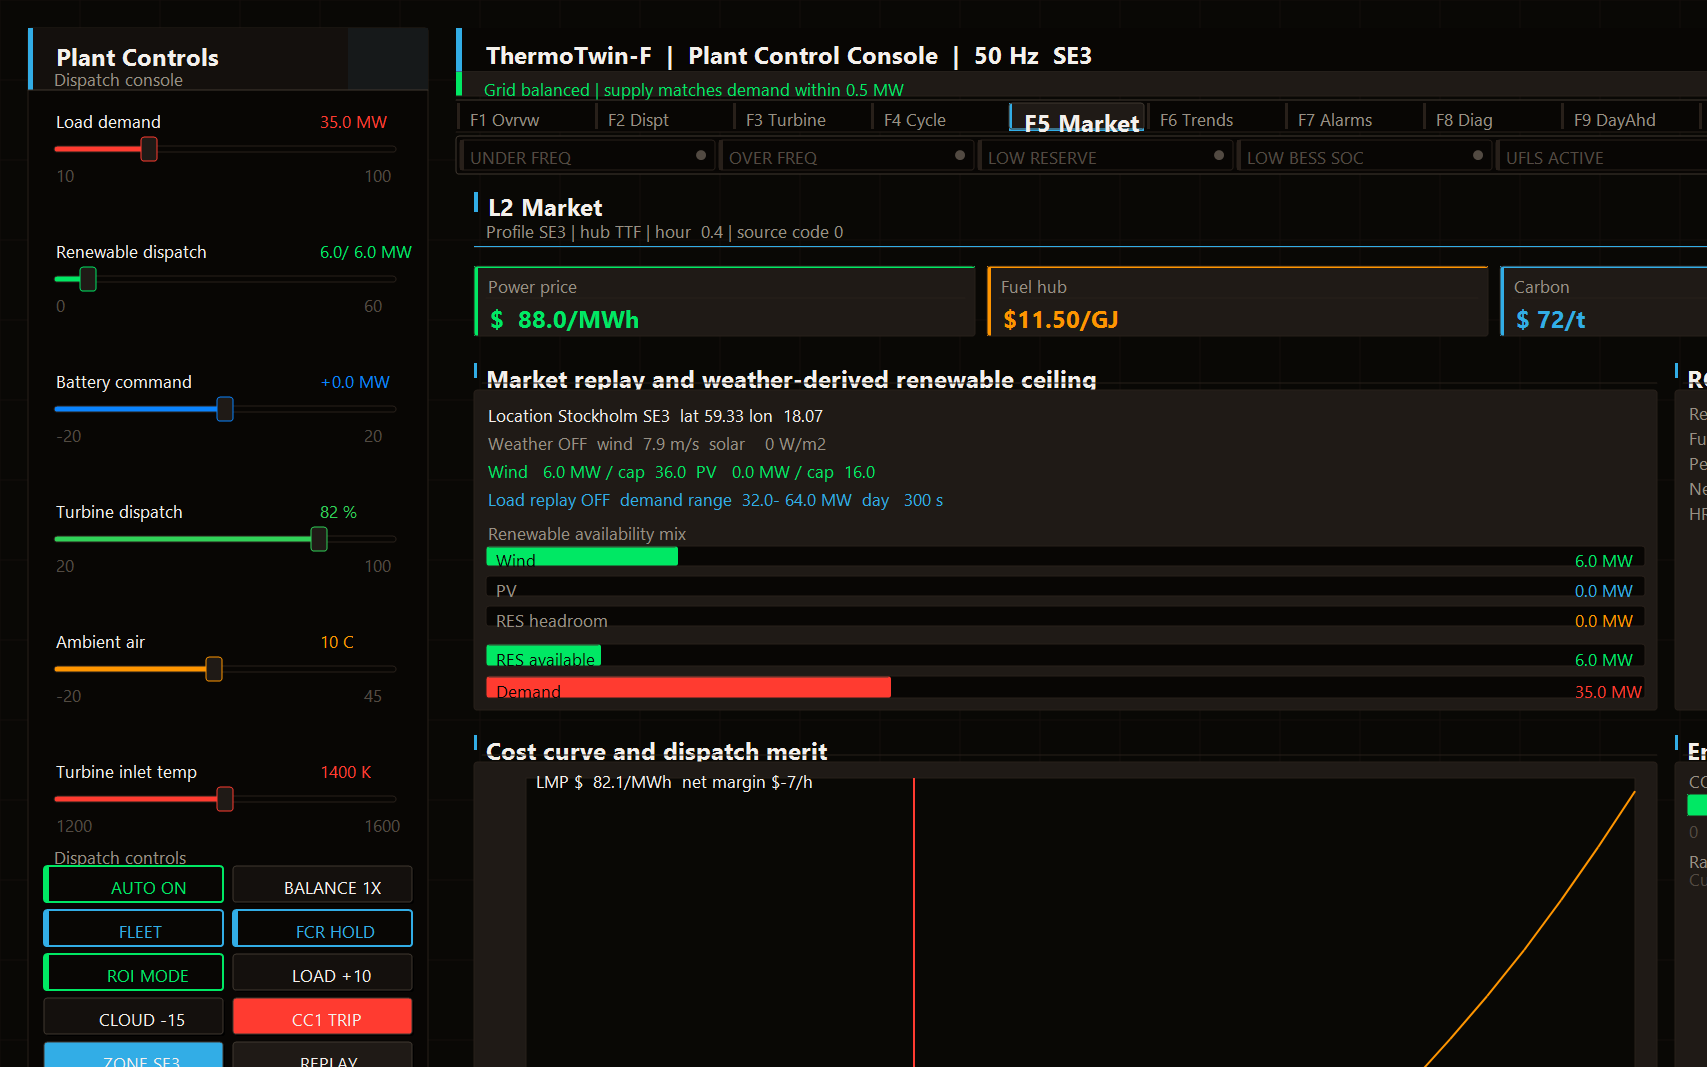
ThermoTwin-F HMI F5 Market screen — price feeds, renewable availability and dispatch merit chart
F5 / Market screenReal-time price feeds (power $88.0/MWh, gas hub $11.50/GJ, carbon $72/t), weather-derived renewable availability mix (Wind 6.0 MW available, PV 0 W/m²), and a live cost-curve and dispatch-merit chart with LMP overlay. Location Stockholm SE3.
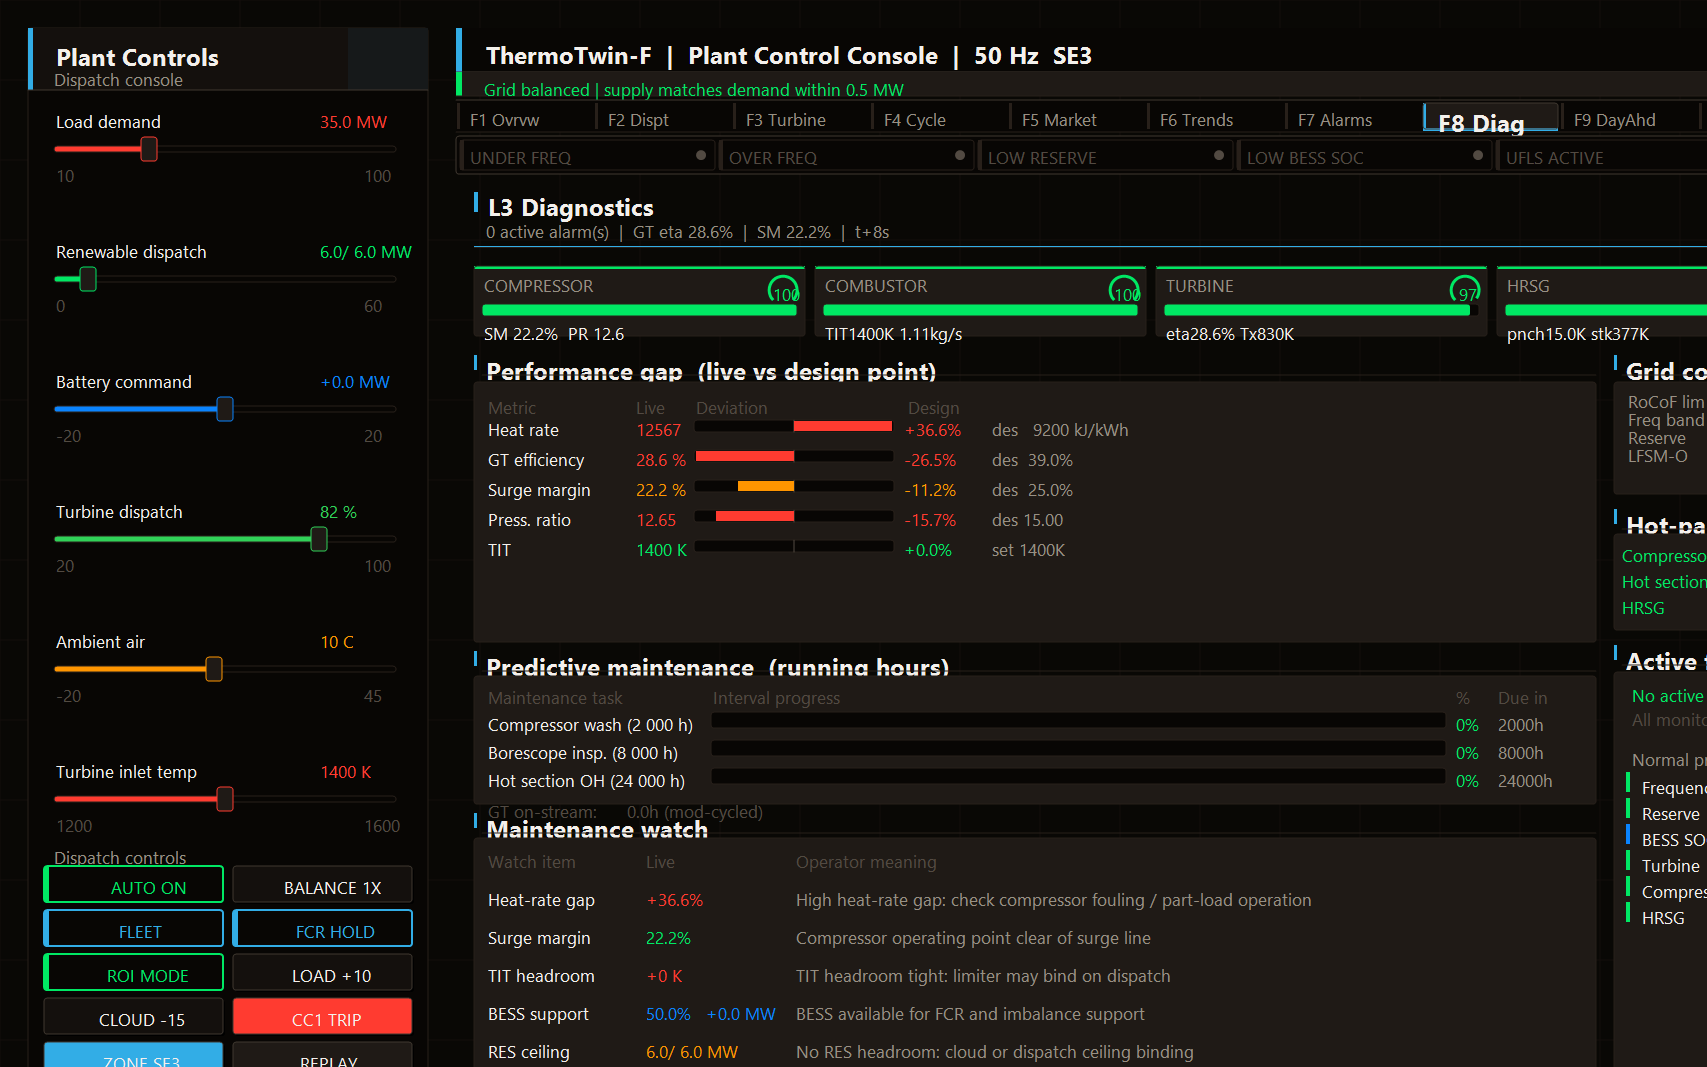
ThermoTwin-F HMI F8 Diagnostics screen — live vs design performance gap and predictive maintenance intervals
F8 / Diagnostics screenL3 Diagnostics: live-vs-design performance-gap bars for heat rate (+36.6%), GT efficiency (−26.5%), surge margin (−11.2%), pressure ratio (−15.7%) and TIT (+0.0%). Below: predictive maintenance interval progress for compressor wash (2000 h), borescope inspection (8000 h) and hot-section overhaul (24 000 h), with an operator maintenance-watch advisory panel.

Development history

Seven releases, iterative and shippable at every commit

Release Theme What it added
1.x – 4.x Capability Cycle solver; degradation, transient, sensor/uncertainty, inverse diagnostics; combined-cycle + fleet dispatch; day-ahead MINLP; DNN surrogate; anomaly/fault ML; P2X/CCS/GFM/tie-line/MPC; H2 co-firing; scenario engine + regression suite — 15 screens, functionally complete.
5.0 Product polish Header/shell redesign; design-token + component layer; flagship executive landing screen with health ring and click-through faceplates; density rebalance; model-validation harness; economic-MPC horizon view; physics-fidelity overlays; scenario comparison; branded PDF/CSV reporting.
6.0 Blueprint Technical UI Seven-theme engine; monospace numerics; line-art icon set; full P&ID schematic engine; motion (self-drawing boot, alarm pulse); product shell (nav rail + Ctrl-K palette); shared chart crosshair/tooltip + sparklines; accessibility (density, UI-scale, colour-blind-safe, focus rings); demo/auto-tour + one-key PNG export.
7.0 Pure physics & scientific analysis Exergy/second-law engine + live Grassmann screen; thermophysical fidelity (NASA-9 gas, IAPWS-IF97 steam, ε-NTU HRSG); combustion chemistry (Zeldovich NOx, CO, H2/Wobbe/flashback, cooling-air, tip-clearance); Monte-Carlo UQ; Saltelli/Jansen Sobol + tornado; WLS data reconciliation + χ² gross-error; Carnot/Curzon–Ahlborn/Brayton limits + T–s envelope; aggregated scientific report embedded in every export.

Codebase footprint

Scale and component breakdown

Component Files Lines
Fortran — engine (src/) 54 8,263
Fortran — native GUI (gui/gui_win32.f90) 1 11,005
Fortran — CLI driver (app/main.f90) 1 462
Fortran — unit tests (test/) 28 ≈1,934
Fortran — total 84 ≈21,664
C++ — GDI+ render backend 1 362
C — OPC UA wrapper 1 ≈250
Python — post-processing / report / DNN 12 1,760

Limitations

What this project does and does not claim

Consistent with the project’s standing honesty note:

  • This is a non-proprietary, educational simulator built on textbook thermodynamics with representative property values. It is verified against an independent hand calculation but not validated against any specific commercial engine, and it is not ASME PTC 22 / ISO 2314 compliant — the numbers are physically plausible illustrations, not predictions for a particular machine.
  • Bottoming-cycle exergy in the P1 accounting is lumped rather than station-resolved.
  • Data reconciliation uses a single constraint rather than a full multi-constraint network.
  • Zeldovich NOx and CO correlations are simplified.
  • The DNN surrogate is trained against a dispatch-label formula, not measured field data.

Each of these is documented at its point of use in the codebase and the technical report. Because property values are representative, absolute KPIs should be read comparatively (clean vs degraded, scenario A vs B, actual vs limit) rather than as machine-specific truth.

Relevance

How it fits the portfolio

Thermodynamic rigour

Every model closes its governing mass/energy/exergy balance to a stated tolerance. Reference formulations are named and citable: IAPWS-IF97, NASA-9 polynomials, ε-NTU, Sobol’, Jansen, Curzon–Ahlborn.

Software-engineering maturity

A clean modular Fortran architecture with an explicit dependency graph, dual build paths (fpm + Makefile), a disciplined test suite, and deterministic RNG seeding for reproducible stochastic studies.

Uncertainty literacy

Headline numbers carry confidence intervals with explicit provenance — Monte-Carlo propagation and variance-based Sobol attribution rather than asserted point estimates.

Systems legibility

A native, dependency-light Win32/GDI+ HMI with 16 analysis screens, a P&ID schematic engine, seven live themes, and one-key scientific report export makes the physics accessible without a proprietary framework.

Verification vs validation — stated plainly

ThermoTwin-F is verified against an independent hand calculation and a 28-test suite. It is not validated against a specific instrumented asset; validation against field data would require a named engine and measured performance maps. This boundary is documented in the technical report (THERMOTWIN-F_TECHNICAL_REPORT.md, §10.2) and at the project README honesty note.

Project access

Source and report

ThermoTwin-F is an open-source educational simulator. Source code, build instructions, tests and the technical report are available on GitHub. The report and numerical illustrations on this page are historical examples, not newly reproduced results or external asset validation. Revamp 7 describes an implementation phase, not a tagged release. The commit review records the checks actually performed and remaining release work.