Project library
Project evidence for research and industrial R&D.
Case studies grouped by method: high-temperature thermal-fluid validation, industrial decarbonization and electrification, energy/process modelling, experimental coursework, optimisation and reproducible engineering tools.
Steam / power / digital twin / RTO
OpenSteamOpt · Steam & power RTO
A two-boiler steam-and-power twin with carbon-aware scheduling, FMI 2.0 simulation and a local advisory GUI. Synthetic and uncalibrated—not an ABB product or live control system.
OpenSteamOpt · Steam & power RTO
A two-boiler steam-and-power twin with carbon-aware scheduling, FMI 2.0 simulation and a local advisory GUI. Synthetic and uncalibrated—not an ABB product or live control system.
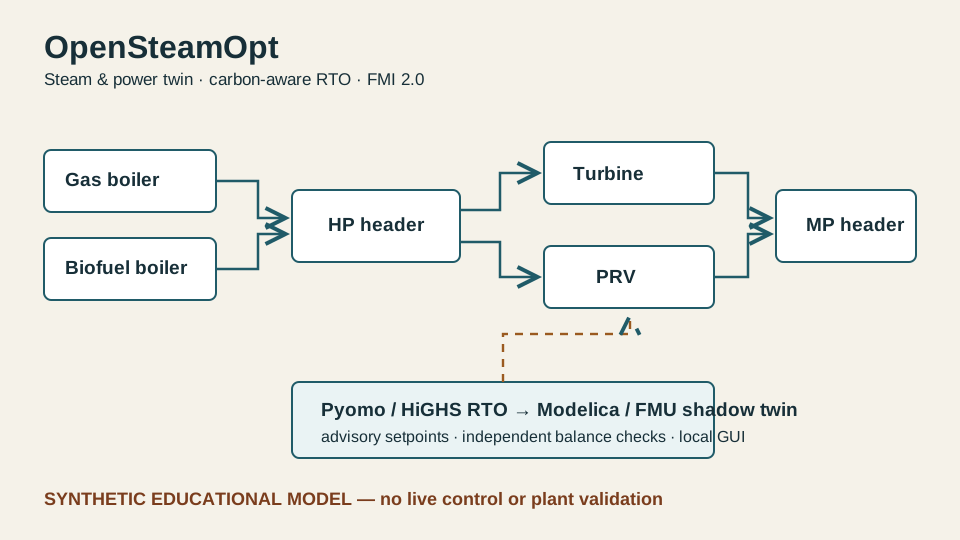
Inspect the plant contract, three synthetic sensitivity cases, independent balance/objective checks, byte-reproducible reference pack and real OpenModelica-to-FMPy integration receipt. The Streamlit application runs locally.
Optimisation / agents / market design
GB-FLEXABM · Electricity investment
A local experiment GUI compares heterogeneous investors with a central planner using shared dispatch. Synthetic and exploratory—not a calibrated GB forecast.
GB-FLEXABM · Electricity investment
A local experiment GUI compares heterogeneous investors with a central planner using shared dispatch. Synthetic and exploratory—not a calibrated GB forecast.
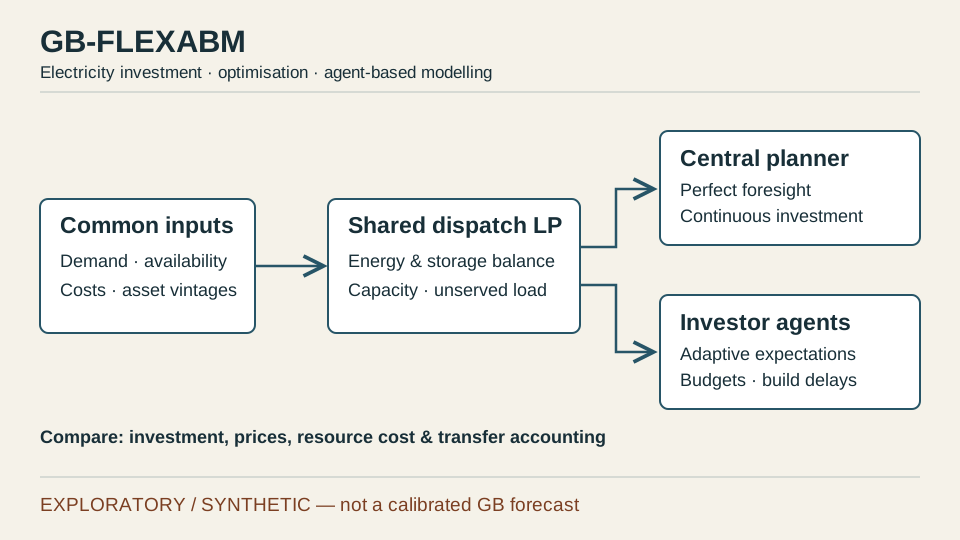
Configure paired experiments and export verified evidence through the local GUI. Training-demand checks, bounded ERA5 acquisition and 804 audited Elexon responses expose the remaining data gaps. Historical calibration, locked evaluation and heat/hydrogen remain unfinished.
CFD / CHT
Siemens Energy CFD/CHT Thesis – Gas Turbine Reducer Thermo-Fluid Analysis
Compressible CFD and conjugate heat transfer analysis of reducer geometries for the Pulsatorn high-temperature dynamic pressure sensor calibration rig at Siemens Energy Finspång.
Siemens Energy CFD/CHT Thesis – Gas Turbine Reducer Thermo-Fluid Analysis
Compressible CFD and conjugate heat transfer analysis of reducer geometries for the Pulsatorn high-temperature dynamic pressure sensor calibration rig at Siemens Energy Finspång.
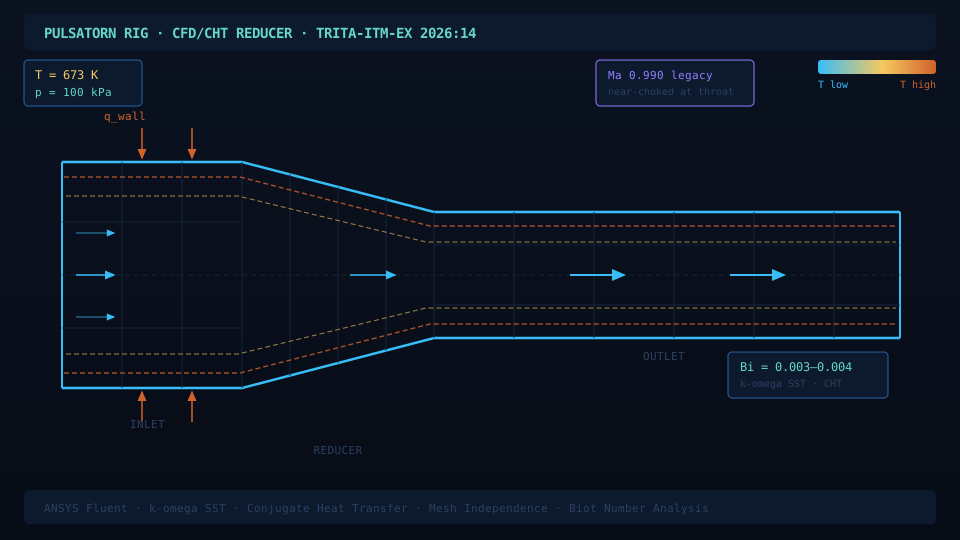
- Built steady-state compressible CFD and CHT models in ANSYS Fluent (k-omega SST) at T = 673 K and P_gauge = 100 kPa within one Siemens Energy thesis campaign.
- Mesh independence study confirmed discretisation error below 2% on pressure-loss coefficient and peak Mach number.
- Biot number analysis (Bi = 0.003-0.004) separated thermal contributions from flow-regime differences between reducer designs.
- Commissioned NI-DAQ measurement chain, modified LabVIEW VI, and led root cause analysis of heater failure during 700°C testing.
Structural FEA
Structural FEA Reactor Internals Pilot Study
Westinghouse-role-fit ANSYS Mechanical pilot study for a simplified reactor-internals-inspired stainless-steel support plate, covering mesh convergence, load-case screening, reaction checks, LC4R support mapping and boundary-condition judgement.
Structural FEA Reactor Internals Pilot Study
Westinghouse-role-fit ANSYS Mechanical pilot study for a simplified reactor-internals-inspired stainless-steel support plate, covering mesh convergence, load-case screening, reaction checks, LC4R support mapping and boundary-condition judgement.
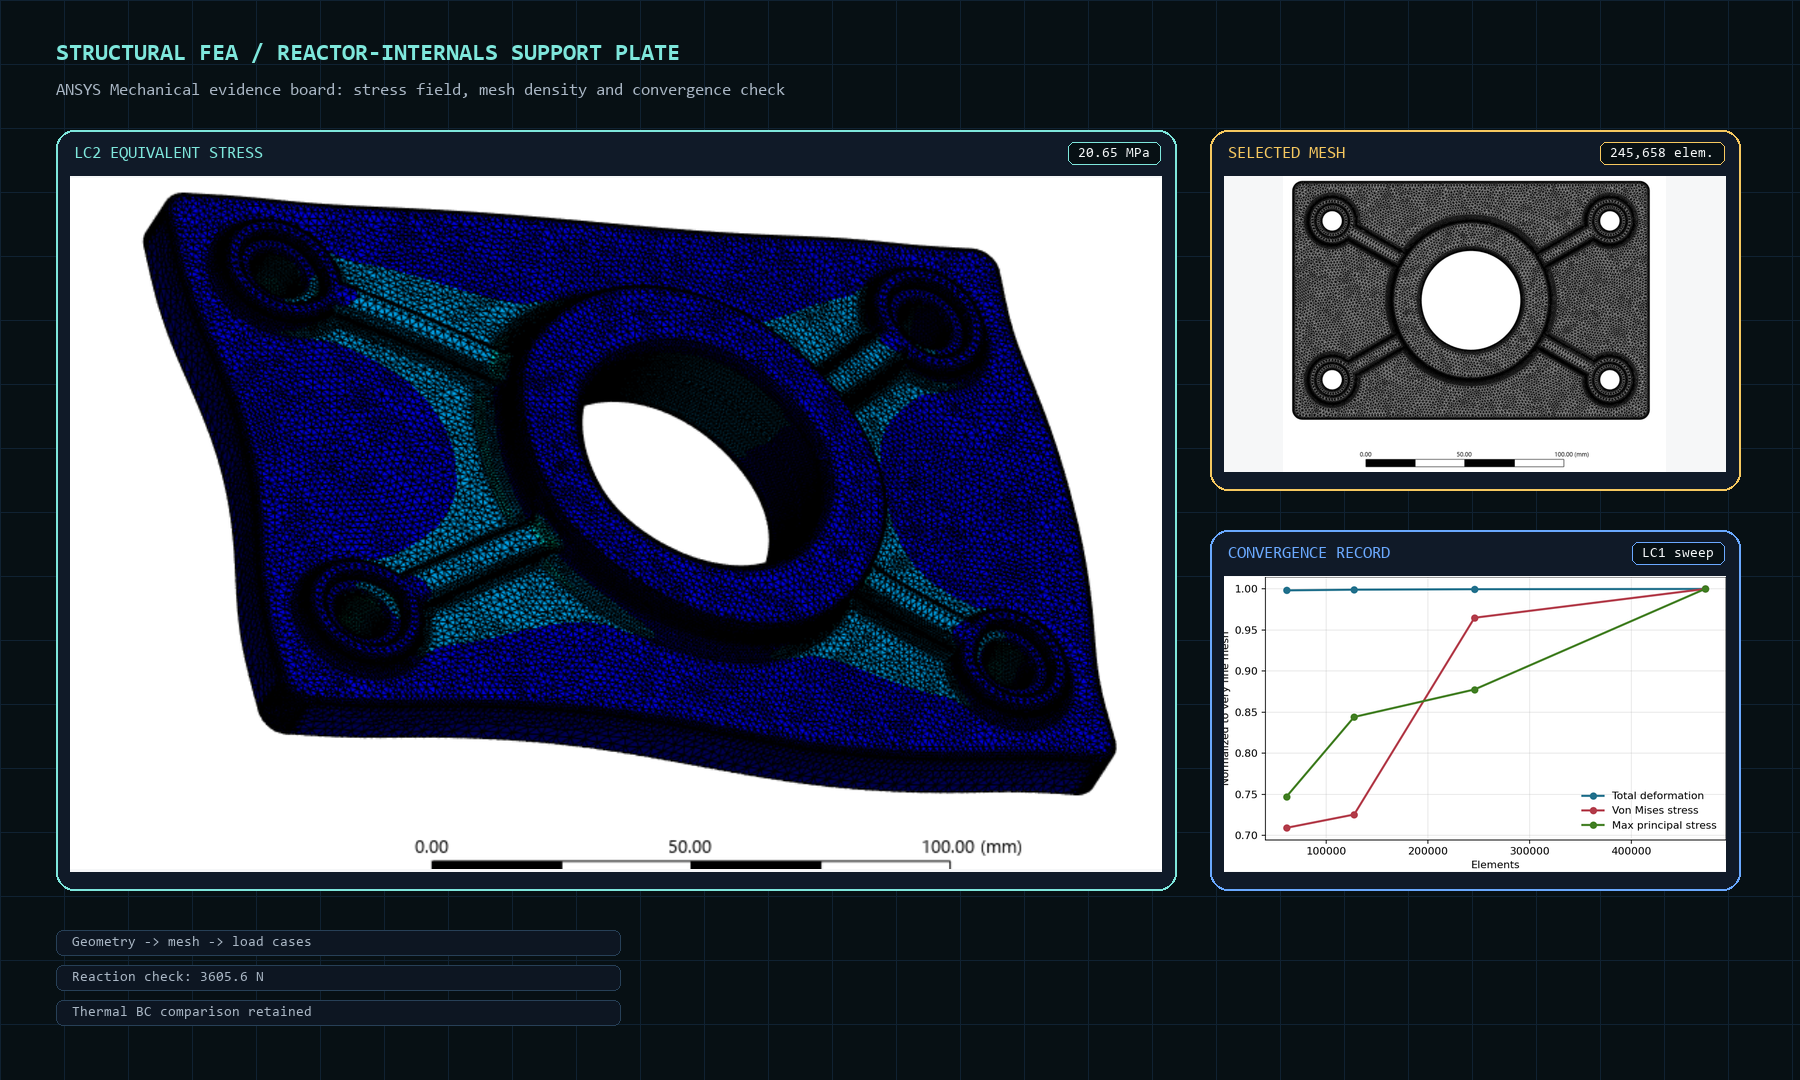
- Screened LC1-LC3 mechanical load cases with reaction-force checks and preliminary factors of safety against an assumed 205 MPa screening yield.
- Ran LC1 mesh convergence from coarse to very fine; final reporting used the fine mesh with 416,866 nodes and 245,658 elements.
- Documented the final LC4R global-coordinate RD1/RD2/RD3 support mapping and rejected pivot, missing-result-file or disconnected-attachment solve states.
- Positioned honestly as an educational ANSYS portfolio study, not an ASME BPVC, Eurocode, EN13001 or certified nuclear-component design calculation.
Energy management
Comparative Energy Audit Methods (consultancy)
Comparative regulatory analysis and tiered audit-method design across multiple EU, Asian and North American jurisdictions. Public-domain methodology summary only — proprietary site detail is not republished.
Comparative Energy Audit Methods (consultancy)
Comparative regulatory analysis and tiered audit-method design across multiple EU, Asian and North American jurisdictions. Public-domain methodology summary only — proprietary site detail is not republished.
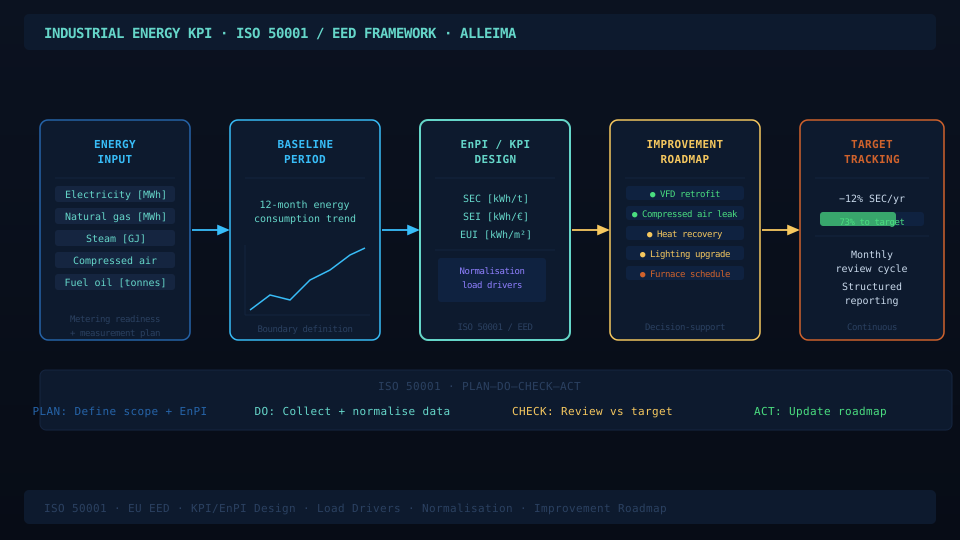
- Translated EU EED-aligned audit obligations into a generic tiered methodology.
- Linked methodology components to EnPI, measurement and follow-up logic.
Energy systems
District Heating Dispatch Optimisation
Stepwise optimisation of a district heating system across base case, future demand, storage integration, cost minimisation and emissions minimisation scenarios.
District Heating Dispatch Optimisation
Stepwise optimisation of a district heating system across base case, future demand, storage integration, cost minimisation and emissions minimisation scenarios.
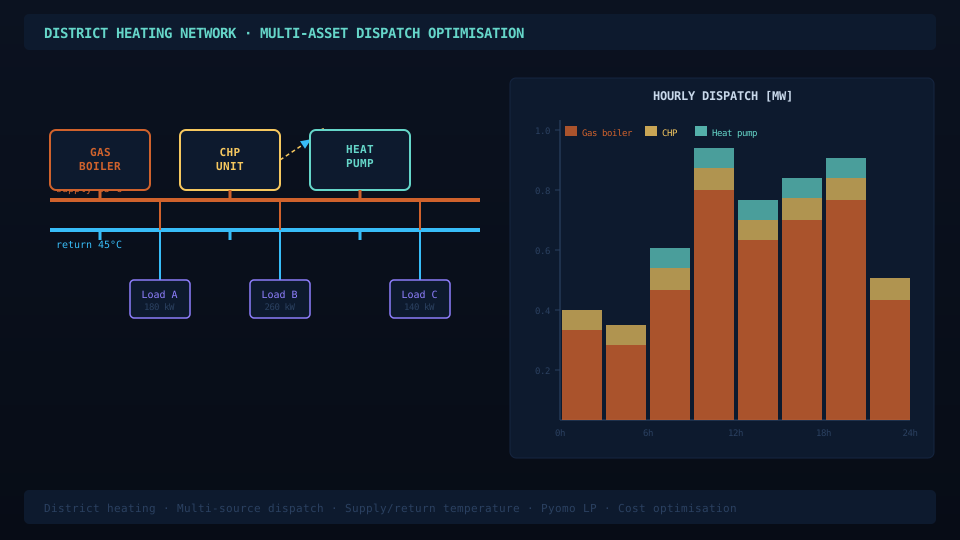
- Built a stepwise dispatch model covering base, future, storage, cost and emissions scenarios.
- Used Python and PuLP to compare heat allocation under resource and demand constraints.
Grid modelling
Distribution Grid Study
CIGRE MV network-style power-flow, N-1 contingency and 24-hour simulation study with EV charging, PV and storage impact analysis.
Distribution Grid Study
CIGRE MV network-style power-flow, N-1 contingency and 24-hour simulation study with EV charging, PV and storage impact analysis.
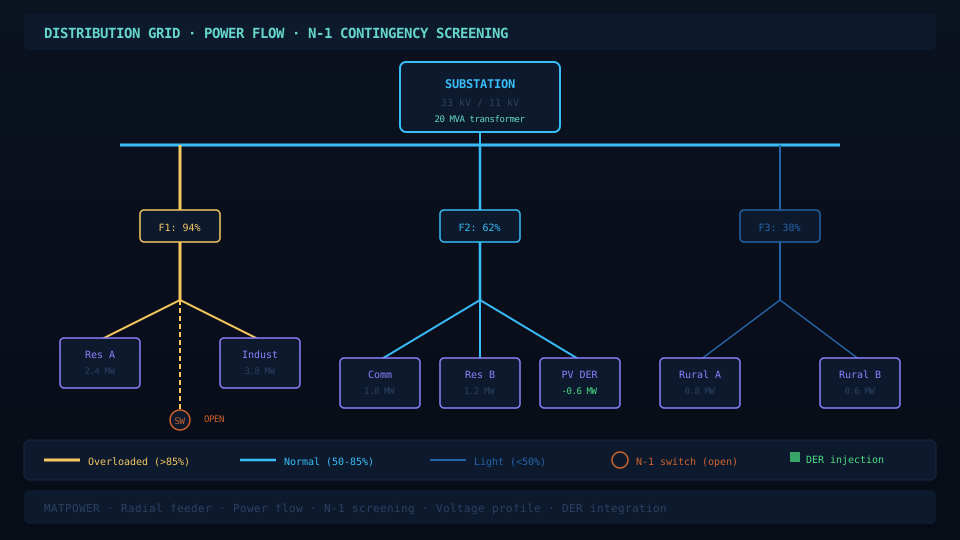
- Screened line loading, voltage behaviour and contingency sensitivity across the 24-hour demand profile.
- Compared EV charging, PV injection and battery storage assumptions on network stress indicators.
Software / analytics
EU ETS Exposure Calculator
Excel and Streamlit toolkit for estimating Scope 1 emissions, EUA cost exposure and carbon-intensity trends for industrial sites.
EU ETS Exposure Calculator
Excel and Streamlit toolkit for estimating Scope 1 emissions, EUA cost exposure and carbon-intensity trends for industrial sites.
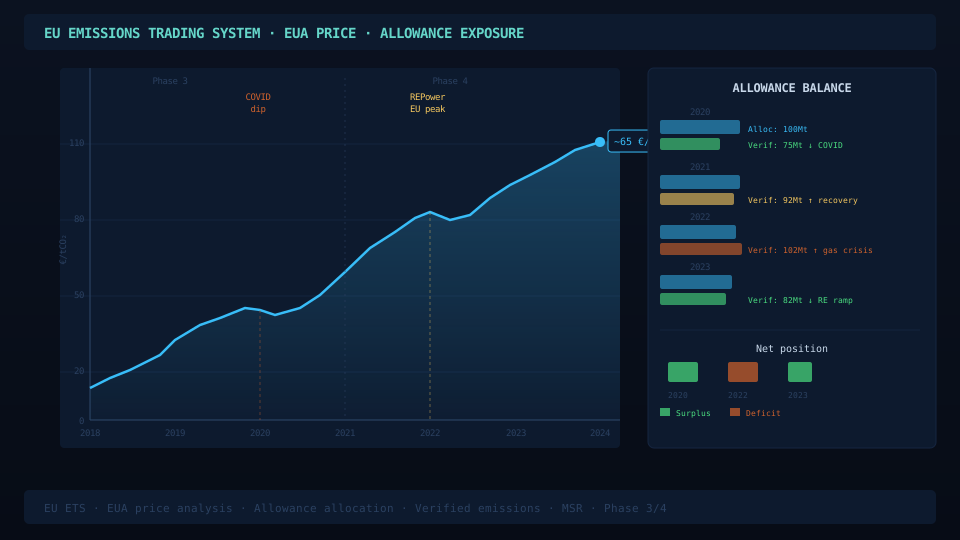
- Calculates ETS scenario summaries and EUA price sensitivity from workbook inputs.
- Includes workbook parsing, CLI runner, PDF export and automated regression tests.
Data / ML
Day-Ahead Heating Demand Forecasting – KTH U-Building
Logistic regression, shallow and deep neural network comparison for day-ahead space heating forecast using Mahalanobis-filtered hourly weather and temporal features.
Day-Ahead Heating Demand Forecasting – KTH U-Building
Logistic regression, shallow and deep neural network comparison for day-ahead space heating forecast using Mahalanobis-filtered hourly weather and temporal features.
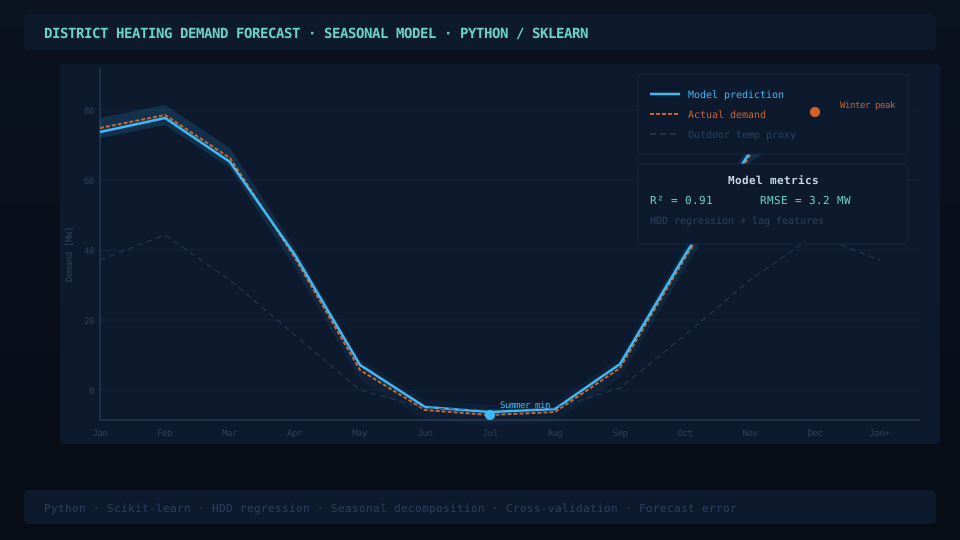
- Engineered hour-of-day, chronological day and weekday features to capture occupancy and seasonal patterns in KTH U-Building (~3,600 m²).
- Two-stage pipeline: initial range-based cleaning then Mahalanobis multivariate outlier removal; MinMaxScaler normalisation.
- SNN (1 hidden layer, 4 neurons) recommended over DNN (6 layers, 8 neurons) on accuracy–compute trade-off.
Energy management
Industrial Energy KPI Toolkit
Python, Excel and Streamlit toolkit for industrial EnPIs, baseline normalisation, anomaly detection and management reporting.
Industrial Energy KPI Toolkit
Python, Excel and Streamlit toolkit for industrial EnPIs, baseline normalisation, anomaly detection and management reporting.
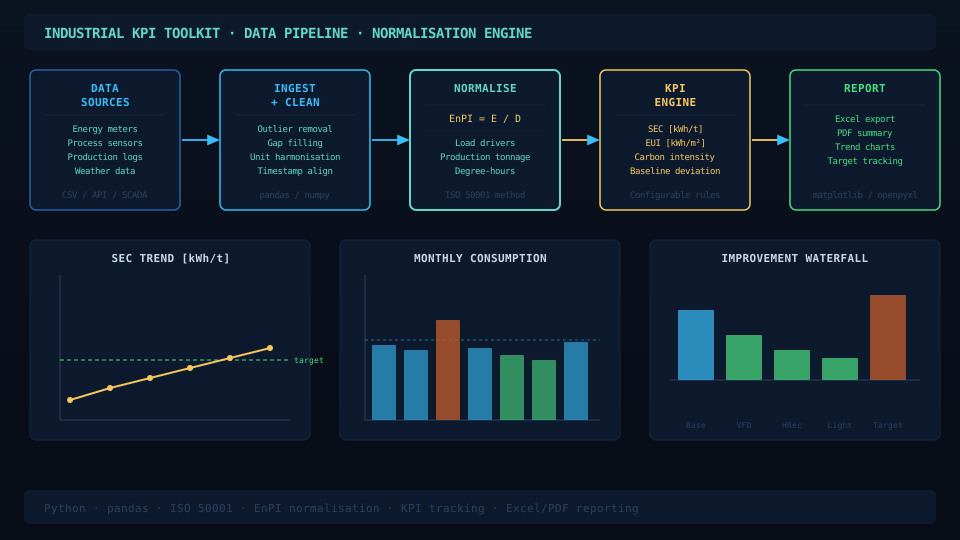
- Generates KPI results, anomaly flags, action logs, plots and one-page PDF reports from meter data inputs.
- Guided Streamlit flow with diagnostics, baseline normalisation and CI quality checks.
Energy systems
PyNEXUS Multi-Vector Dispatch Model
Electricity, hydrogen and heat dispatch (Pyomo/HiGHS) coupling offshore wind, electrolysis, storage, grid exchange and waste-heat recovery, run on a real fetched year of ERA5 wind.
PyNEXUS Multi-Vector Dispatch Model
Electricity, hydrogen and heat dispatch (Pyomo/HiGHS) coupling offshore wind, electrolysis, storage, grid exchange and waste-heat recovery, run on a real fetched year of ERA5 wind.
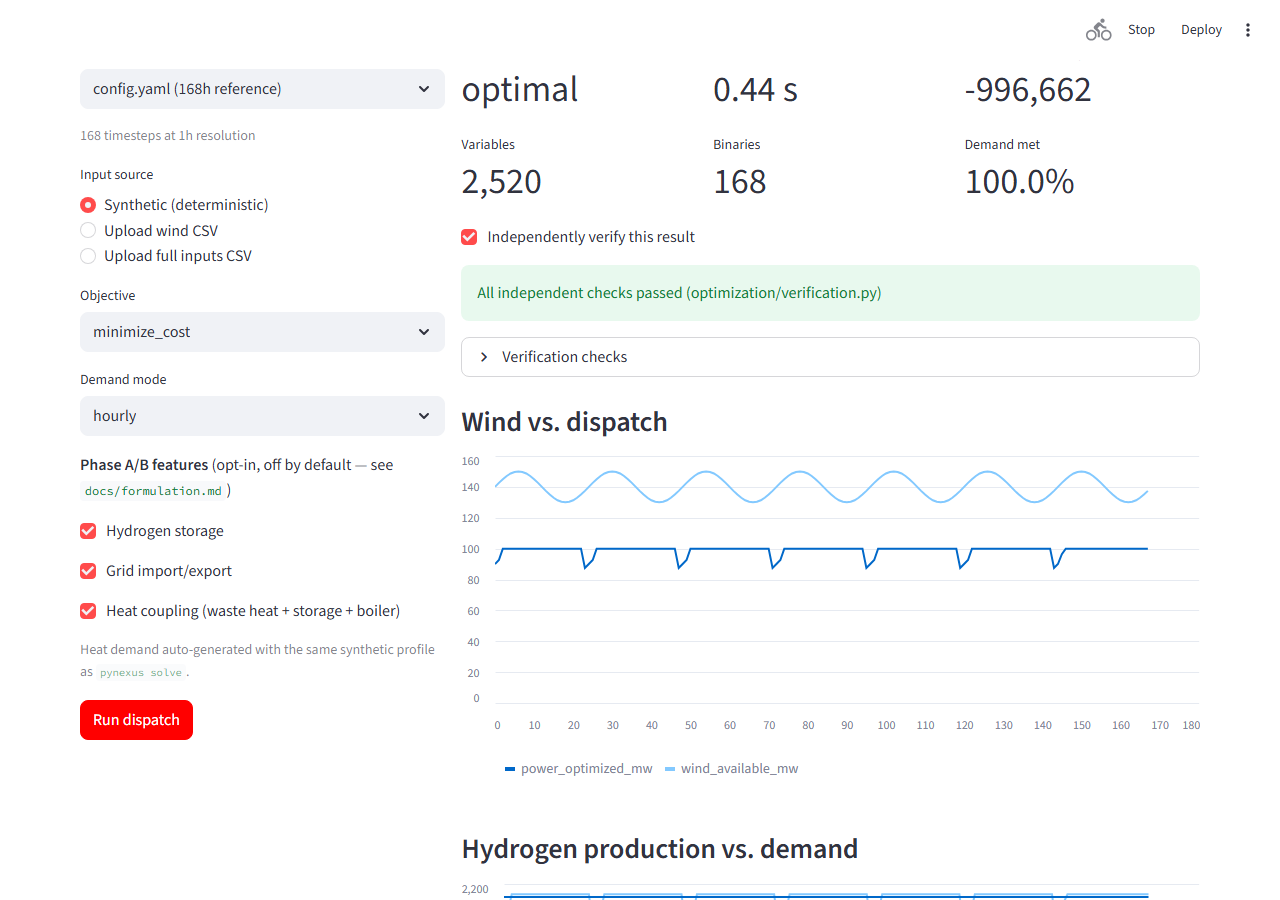
- A real fetched year of ERA5 wind (2023, no gaps) run through the model: the wind-only annual case is genuinely infeasible against demand — a real finding, not hidden.
- Data reconciliation (WLS + chi-square gross-error test) and a Streamlit GUI wrapping the same optimizer/verification code as the CLI.
Energy storage
TES Peak Shaving for District Cooling – Ice Storage vs PCM
Python TES simulation and techno-economic comparison of ice storage and salt hydrate PCM for a shopping centre district cooling network, including break-even and lifetime profit analysis.
TES Peak Shaving for District Cooling – Ice Storage vs PCM
Python TES simulation and techno-economic comparison of ice storage and salt hydrate PCM for a shopping centre district cooling network, including break-even and lifetime profit analysis.
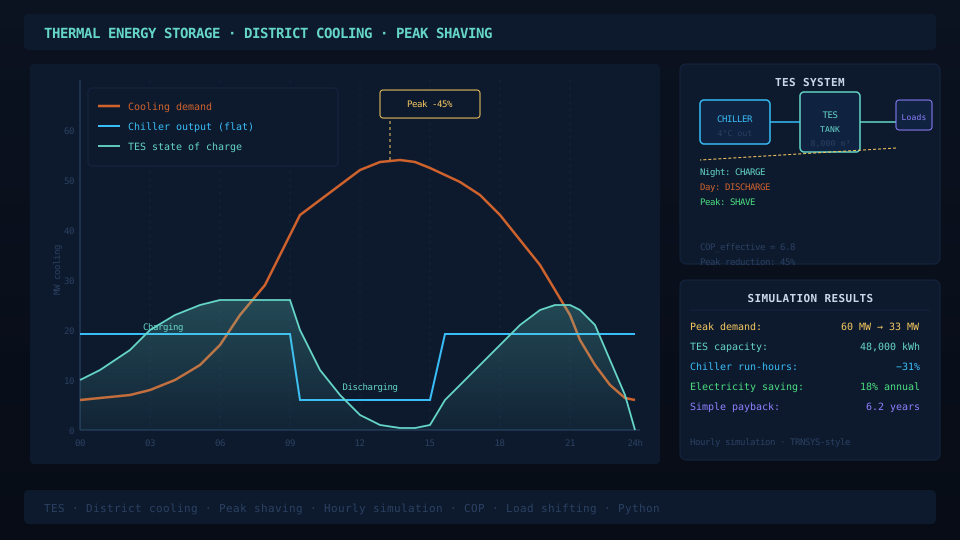
- Python simulation with 1,850 kW threshold, 12-hour look-ahead and dynamic SoC tracking across 8-day demand profile (198–3,391 kW range).
- Sized both technologies to 14,750 kWh: ice storage at 351 tons / 320 m³ vs PCM at 246 tons / 273 m³.
- Concluded ice storage optimal where space is unconstrained; PCM justified only when footprint is a binding constraint.
Energy systems / LEAP
Germany 3E Analysis – Electricity, Cost and CO&sub2; Modelling with LEAP
Scenario-based modelling of Germany’s electricity system to 2045 using LEAP, comparing NDC 2030 targets against nuclear recommissioning on cost and carbon emissions.
Germany 3E Analysis – Electricity, Cost and CO&sub2; Modelling with LEAP
Scenario-based modelling of Germany’s electricity system to 2045 using LEAP, comparing NDC 2030 targets against nuclear recommissioning on cost and carbon emissions.
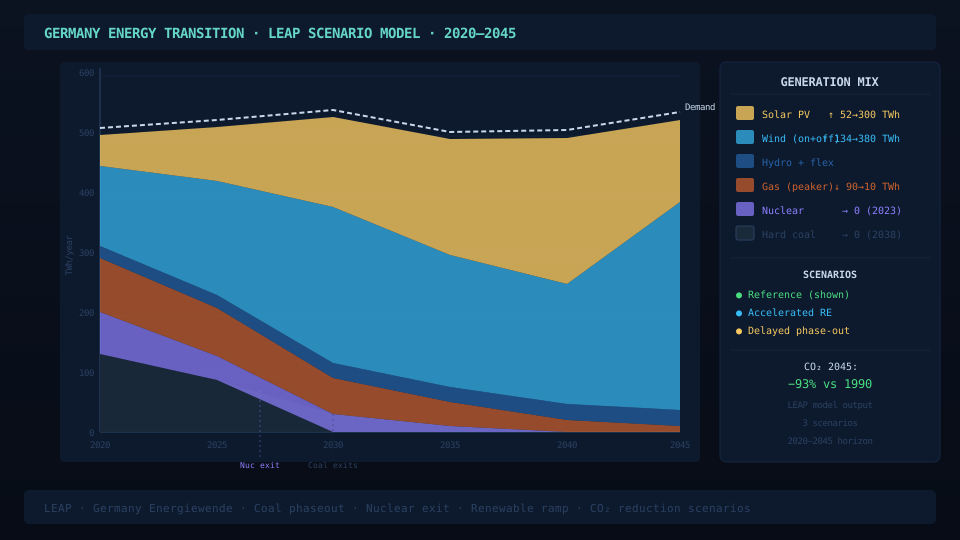
- Built demand model covering households, industry, transport electrification (EVs, rail) and commercial services to 2045.
- Compared NDC 2030 pathway against recommissioning 12.1 GW of recently decommissioned nuclear capacity.
- Contributed Sankey diagram, SDG 7.1 energy poverty analysis and sustainable development section.
Energy management / buildings
Hylkysaari Island – Smart and Sustainable Tourism Energy Design
Building energy simulation, microgrid modelling and economic evaluation for a sustainable tourist island near Helsinki, with a guest-facing energy dashboard business model.
Hylkysaari Island – Smart and Sustainable Tourism Energy Design
Building energy simulation, microgrid modelling and economic evaluation for a sustainable tourist island near Helsinki, with a guest-facing energy dashboard business model.
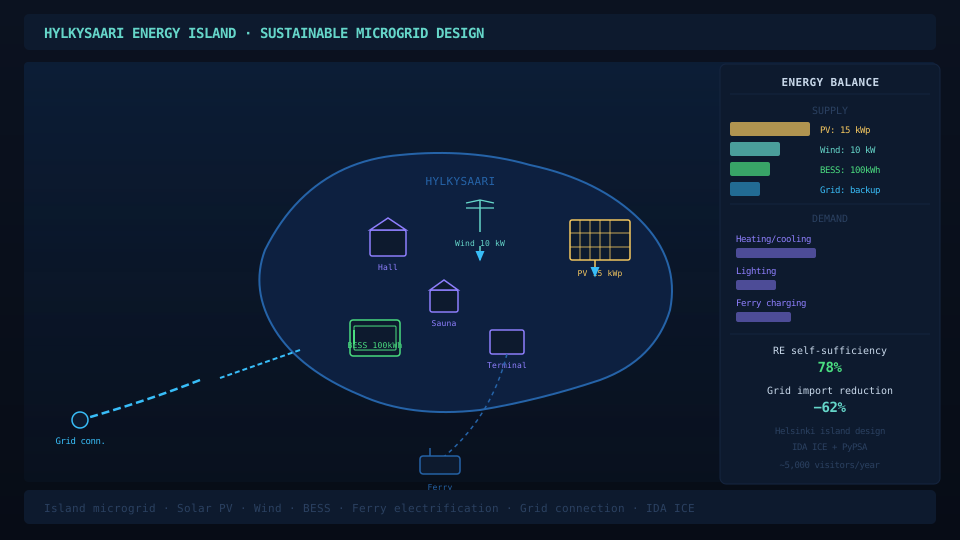
- Modelled building energy use in IDA ICE and microgrid in HOMER PRO across three design scenarios.
- Economic evaluation (NPV, BCR, DPP) showed solar PV + improved insulation + waste heat recovery as optimal combination.
- Designed guest-facing “Hylkysaari Vihreä Program” business model with real-time energy dashboard and carbon offset scheme.
Techno-economic analysis / solar thermal
Residential Heating Techno-Economics – PV, Heat Pump and Solar Thermal vs District Heating
Four-scenario comparison for replacing district heating at BRF Årstaterrassen (423 apartments, Stockholm) during summer: solar thermal collectors win with a 5-year payback and $128.6/MWh LCoE; PV + electric boiler eliminated at 14% demand coverage.
Residential Heating Techno-Economics – PV, Heat Pump and Solar Thermal vs District Heating
Four-scenario comparison for replacing district heating at BRF Årstaterrassen (423 apartments, Stockholm) during summer: solar thermal collectors win with a 5-year payback and $128.6/MWh LCoE; PV + electric boiler eliminated at 14% demand coverage.
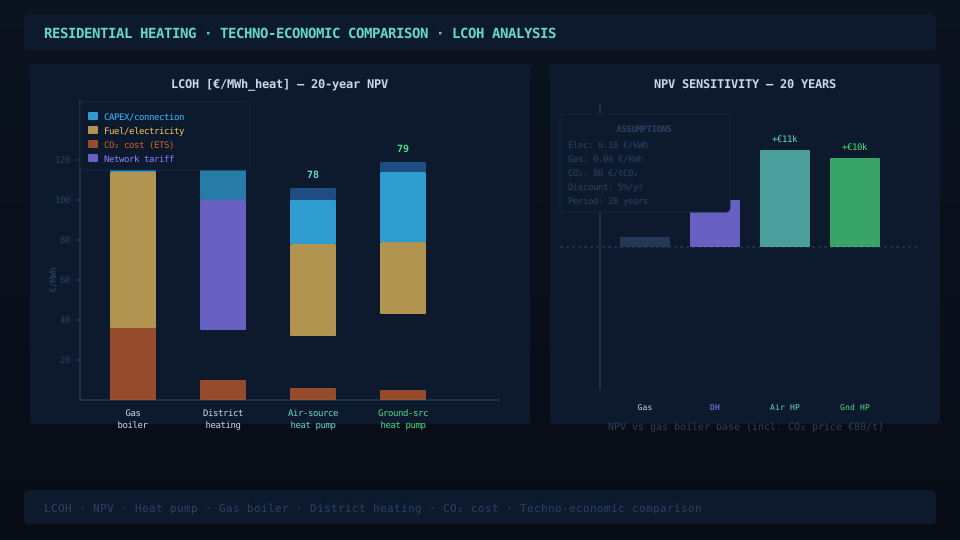
- Demand computed from 2,604.4 MWh/yr annual baseline, scaled to September worst-case of 2,000 kWh/day using district heating monthly demand data.
- Wagner-Solar C20 AR-M collectors (85.4% optical efficiency, 2.61 m²): 309 units covering 806 m² generate 5,148.5 kWh/day; TES volume 2.95 m³ for nocturnal gap.
- PV + heat pump (COP = 3) is the feasible electrical alternative: 649 panels, $449k CAPEX, 9-year payback — viable but inferior to STC on all KPIs.
Building energy / simulation
Built Environment Energy Simulation – IDA ICE Supply System Comparison
IDA ICE parametric study (heat exchanger, orientation, location) and 11-configuration supply system comparison on bought energy, primary energy and CO&sub2;, plus India built environment decarbonisation policy analysis.
Built Environment Energy Simulation – IDA ICE Supply System Comparison
IDA ICE parametric study (heat exchanger, orientation, location) and 11-configuration supply system comparison on bought energy, primary energy and CO&sub2;, plus India built environment decarbonisation policy analysis.
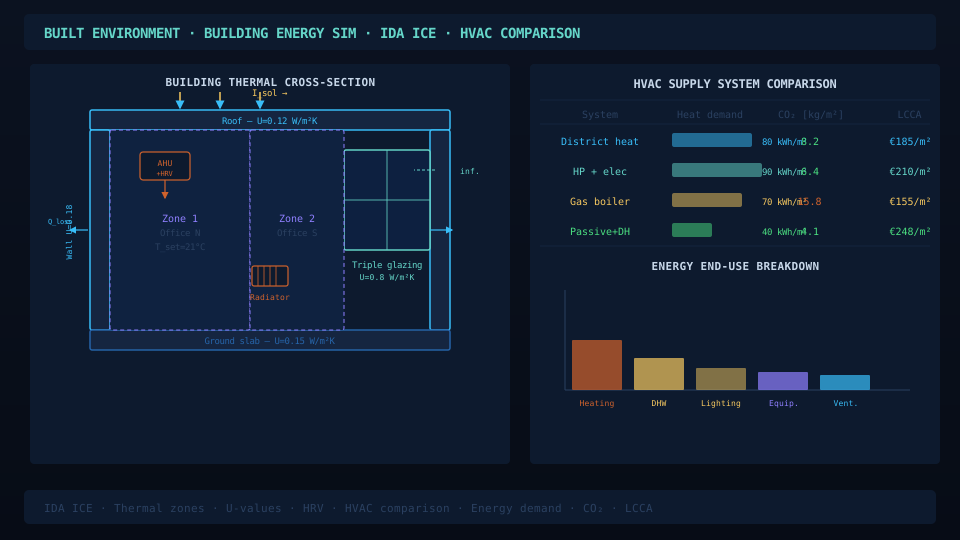
- Parametric IDA ICE study isolating heat exchanger, window blinds, orientation and Barcelona relocation effects on a ~6% PPD baseline.
- 11 supply configurations compared: oil boiler reference, GSHP variants, ASHP, district H&C, and GSHP+PV combinations.
- India policy essay covering ECBC/NBC enforcement, LEED/GRIHA certification, vernacular architecture principles (Nalukettu, Rajasthan) and case studies (Infosys Mysore, Delhi Metro).
Polygeneration / off-grid
Emergency Energy Module – Post-Disaster Polygeneration, Philippines
Modular solar PV, biogas digester and battery system for 3,000 disaster survivors after Cyclone Haiyan, with HOMER PRO economic analysis and a PPP business model.
Emergency Energy Module – Post-Disaster Polygeneration, Philippines
Modular solar PV, biogas digester and battery system for 3,000 disaster survivors after Cyclone Haiyan, with HOMER PRO economic analysis and a PPP business model.
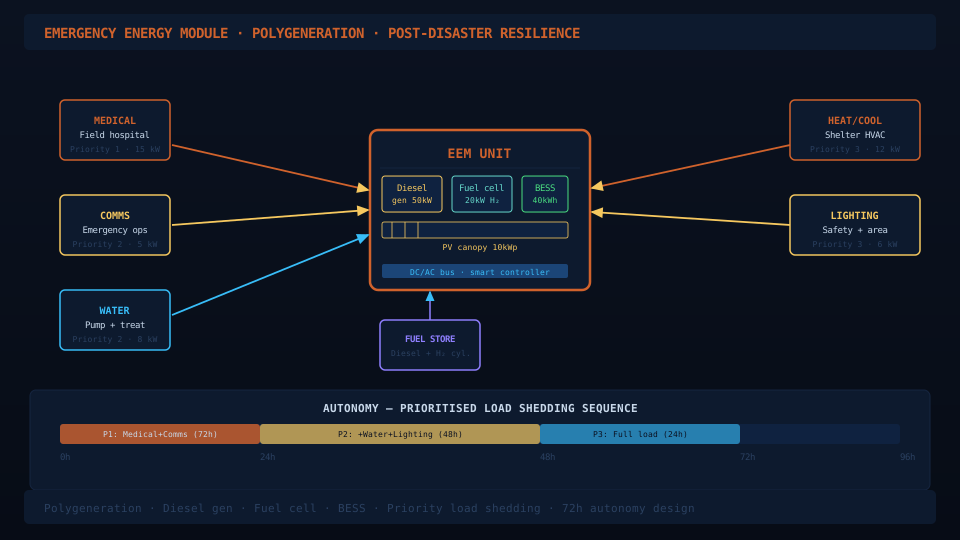
- Sized solar PV (SunPower Maxeon 7, 24.1% eff, 315 m²), 920 m³ biogas digester and 50 kWh LiFePO4 battery within a 40-foot container constraint.
- Digester produces 1,400 m³/day biogas covering 886 kWh/day electricity and cooking fuel for 3,000 people.
- HOMER PRO economic analysis: $444k NPC, 93% OPEX reduction vs. conventional supply, 92.3% IRR.
Test / instrumentation
Rotating Machinery Vibration Mini-Lab
Low-cost vibration measurement workflow using phone accelerometer data, signal filtering, FFT/PSD analysis, spectrograms and automated report generation.
Rotating Machinery Vibration Mini-Lab
Low-cost vibration measurement workflow using phone accelerometer data, signal filtering, FFT/PSD analysis, spectrograms and automated report generation.
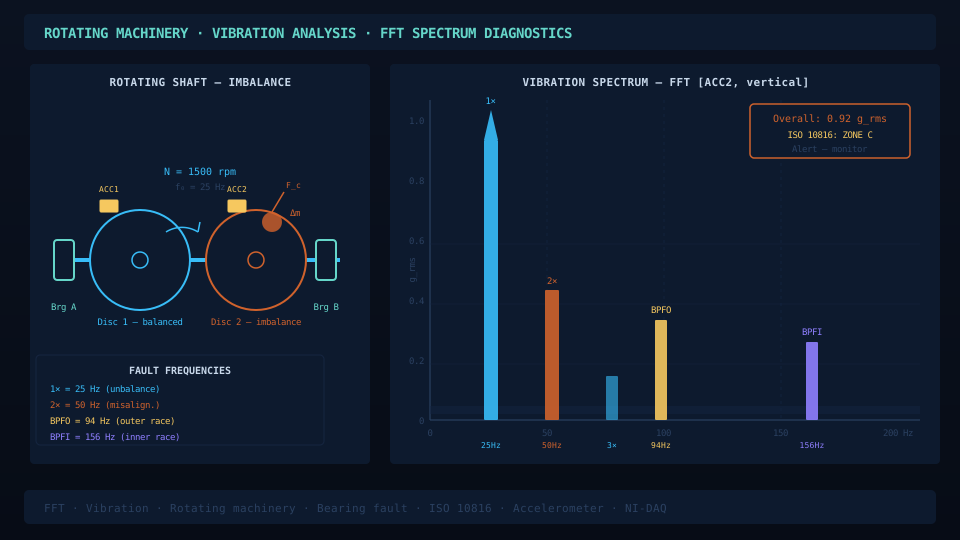
- Compares operating points through frequency fingerprints and RMS metrics from filtered accelerometer signals.
- Packages outputs as HTML reports, plots, spectrograms and summary CSVs.
Energy storage / lab
M-TES PCM Thermal Lab – RT60 HC Discharge Characterisation
Experimental discharge measurement of a latent-heat Mobile TES prototype: 10-sensor temperature logging over 8 hours, three heat-transfer calculation methods, and 99.9% theory–experiment agreement.
M-TES PCM Thermal Lab – RT60 HC Discharge Characterisation
Experimental discharge measurement of a latent-heat Mobile TES prototype: 10-sensor temperature logging over 8 hours, three heat-transfer calculation methods, and 99.9% theory–experiment agreement.
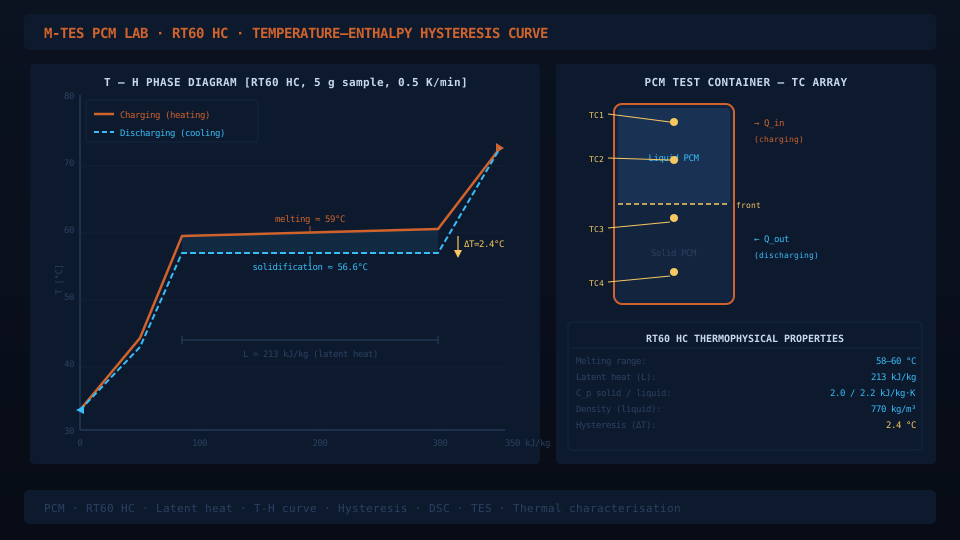
- RT60 HC PCM (33 kg, 44 L) discharged from 71.1°C to 40.1°C via RENOLIN THERM HTF at 2 L/min; 10 PT100 sensors logged every 10 seconds for ~8 hours.
- Three integration methods compared: variable-property (Method 1) and constant-property (Method 2) HTF calculations, with and without stainless-steel tank heat absorption.
- Propagating thermal front identified in sensor pairs 40 minutes apart; outlet temperature profile confirms integrated heat extraction.
Battery characterisation / lab
Battery Cell Discharge Performance Testing – Ni-MH, Li-Po and Lead-Acid
Seven-test discharge characterisation across three chemistries (Ni-MH 780 mAh, Li-Po 420 mAh, Lead-acid 2500 mAh), three C-rates and three temperatures: voltage, SOC and power profiles with Peukert and thermal effects.
Battery Cell Discharge Performance Testing – Ni-MH, Li-Po and Lead-Acid
Seven-test discharge characterisation across three chemistries (Ni-MH 780 mAh, Li-Po 420 mAh, Lead-acid 2500 mAh), three C-rates and three temperatures: voltage, SOC and power profiles with Peukert and thermal effects.
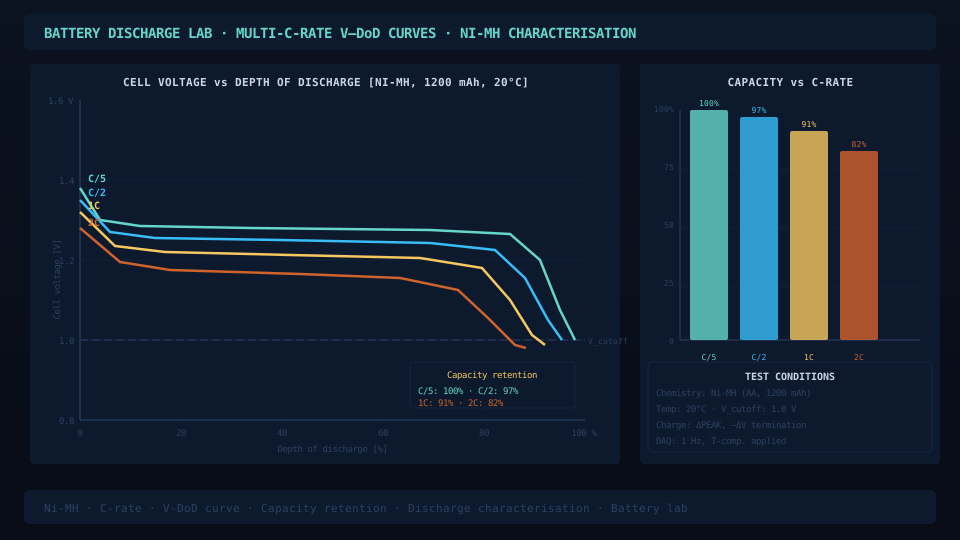
- C-rate tests (Tests 1.1–1.3): voltage plateau collapses at 2C; 0.5C maximises runtime and capacity utilisation across all four analysis dimensions.
- Temperature tests (Tests 2.1–2.2): +40°C improves kinetics and lowers internal resistance; −10°C cuts accessible capacity and power delivery.
- Chemistry tests (Tests 3.2–3.3): Li-Po holds flat ~4 V plateau until 30% SOC then drops sharply; Lead-acid declines linearly from 1.9 V; Ni-MH is predictable across all conditions.
Waste-to-energy / urban energy
Waste-to-Energy Proposals – Delhi and Kozhikode
Delhi MSW crisis policy roadmap (biomethanation → RDF → gasification) and a Kozhikode 11.11 MW WTE plant design coupling a grate incinerator with a 36,000 m³ biogas digester for 214 buses.
Waste-to-Energy Proposals – Delhi and Kozhikode
Delhi MSW crisis policy roadmap (biomethanation → RDF → gasification) and a Kozhikode 11.11 MW WTE plant design coupling a grate incinerator with a 36,000 m³ biogas digester for 214 buses.
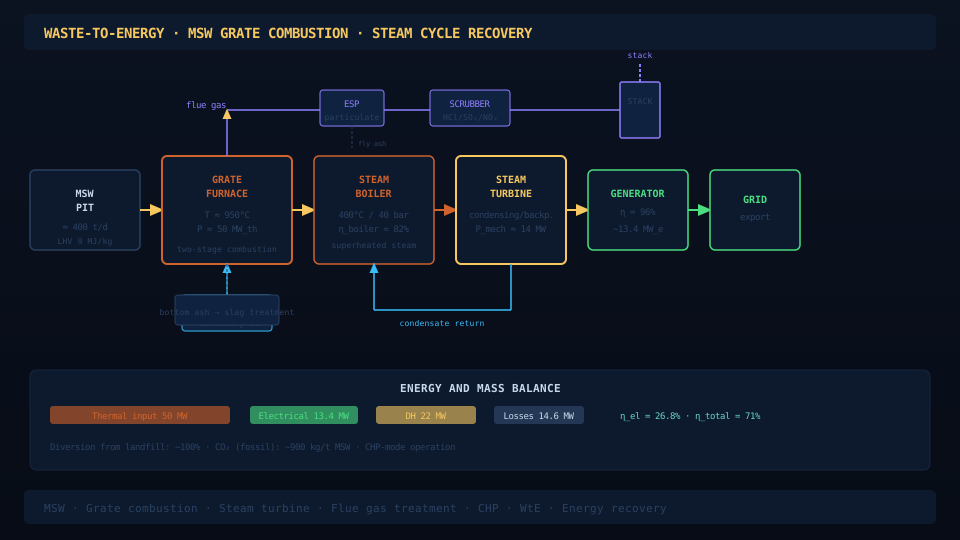
- Delhi proposal: phased technology roadmap matched to segregation reality — biomethanation first, combustion WTE only after 60–70% source segregation achieved.
- Kozhikode: 600 TPD split 50/50 between grate incineration (11.11 MW) and anaerobic digestion (32,200 m³/day biogas, 30-day retention, 36,000 m³ digester).
Numerical methods / Python
Numerical Heat Transfer – Finite Difference, Time-Stepping and Advection Schemes
Python assignments covering catastrophic cancellation, numerical differentiation error analysis, 2D Laplace stencil comparison, Euler vs RK4 time-marching and Lax–Friedrichs vs Lax–Wendroff advection.
Numerical Heat Transfer – Finite Difference, Time-Stepping and Advection Schemes
Python assignments covering catastrophic cancellation, numerical differentiation error analysis, 2D Laplace stencil comparison, Euler vs RK4 time-marching and Lax–Friedrichs vs Lax–Wendroff advection.
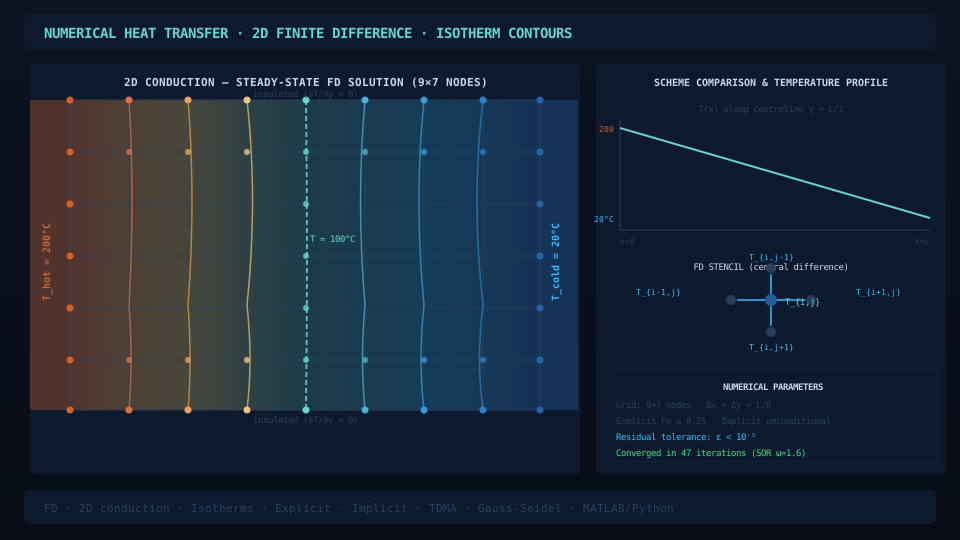
- HA1: floating-point cancellation (100% error in single-precision for large-magnitude case), differentiation truncation–roundoff balance, 2D Laplace 5-pt vs 9-pt stencil grid convergence.
- HA2: Euler vs RK4 stability limits and convergence; Lax–Friedrichs numerical diffusion vs Lax–Wendroff second-order accuracy for smooth wave advection.
Digital twin · gas turbine / CCGT · Modern Fortran
ThermoTwin-F – Gas Turbine and CCGT Digital Twin
Self-initiated Modern Fortran digital twin: ~21,700 lines across 54 modules, native Win32 HMI, exergy/second-law analysis suite, Monte-Carlo UQ, Sobol sensitivity and 28 passing unit tests at a calibrated 52.8 % combined-cycle design point.
ThermoTwin-F – Gas Turbine and CCGT Digital Twin
Self-initiated Modern Fortran digital twin: ~21,700 lines across 54 modules, native Win32 HMI, exergy/second-law analysis suite, Monte-Carlo UQ, Sobol sensitivity and 28 passing unit tests at a calibrated 52.8 % combined-cycle design point.
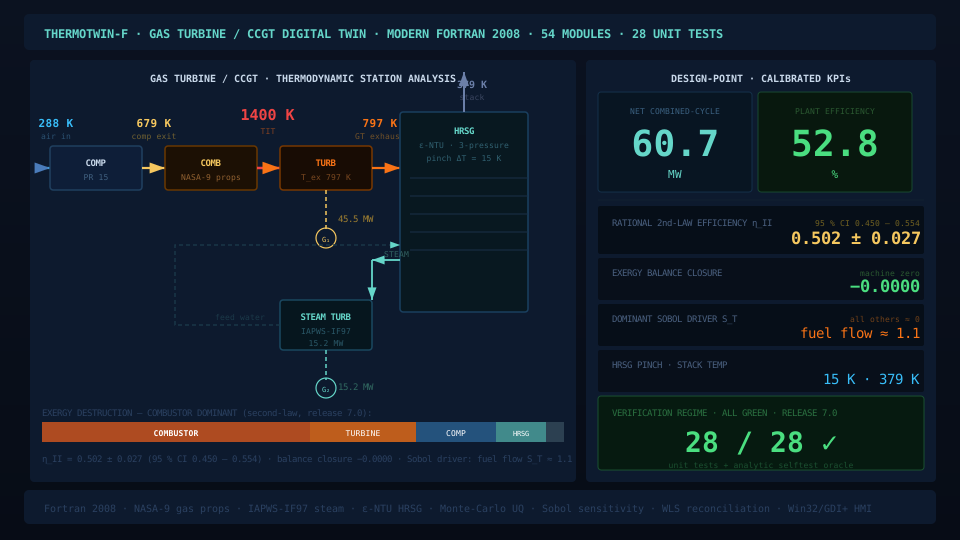
- ~21,700 lines Modern Fortran across 54 engine modules and a ~11,000-line native Win32/GDI+ HMI, all sharing one
GridStatecontract. - Second-law suite: exergy accounting, Monte-Carlo UQ, Saltelli/Jansen Sobol sensitivity, WLS data reconciliation with χ² gross-error detection, and Carnot/Curzon–Ahlborn theoretical-limit benchmarking.
- Exergy balance closes to machine zero; combustor dominates irreversibility; fuel flow is the sole Sobol driver of ηII (ST ≈ 1.1).
Entrepreneurship / energy tech
GridFlex – ML-Driven Energy Storage Optimisation Concept
KTH entrepreneurship assignment: a predictive ML platform for real-time storage dispatch in renewable grids, addressing 5% curtailment and 30% storage waste — idea screen score 87/100 with full Business Model Canvas.
GridFlex – ML-Driven Energy Storage Optimisation Concept
KTH entrepreneurship assignment: a predictive ML platform for real-time storage dispatch in renewable grids, addressing 5% curtailment and 30% storage waste — idea screen score 87/100 with full Business Model Canvas.
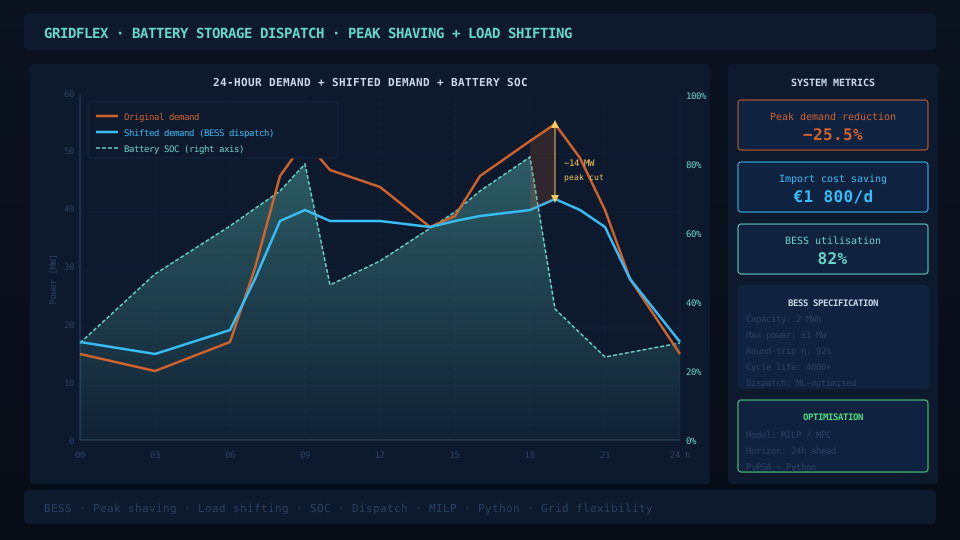
- Three-iteration concept development via SCAMPER: rule-based → weather-forecast-driven → real-time ML with historical grid pattern learning.
- Multi-storage compatibility (Li-ion, pumped hydro, thermal, flywheel) differentiates from Fluence/Stem focus on utility-scale batteries.
- Business Model Canvas: SaaS subscription primary revenue, premium analytics add-on, one-time integration fees.
B.Tech final year / robotics
B.Tech Final Year Interactive Robot Project
Final-year interactive robot project combining IRJET control-system integration work with published frame and locomotion design: Raspberry Pi/cloud control, surveillance, SOC indication, steering integration and mechanical drivetrain sizing.
B.Tech Final Year Interactive Robot Project
Final-year interactive robot project combining IRJET control-system integration work with published frame and locomotion design: Raspberry Pi/cloud control, surveillance, SOC indication, steering integration and mechanical drivetrain sizing.
- IRJET DOCX manuscript covers robotic control-system and subsystem integration for the final-year project.
- Control scope included cloud/voice control, surveillance, SOC indication, environmental sensing and servo steering integration.
- Mechanical publication covers wheelbase stability, drivetrain torque sizing, compound gear reduction and ANSYS screening.