The problem
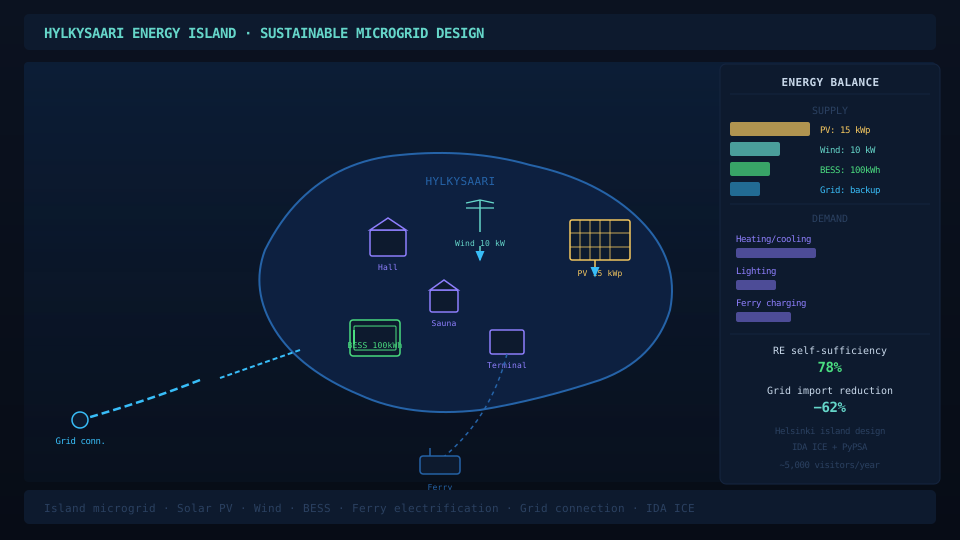
Hylkysaari is a 40,000 m² island in the Gulf of Finland, connected to Korkeasaari Zoo by two land bridges. Valo Finland purchased it to transform it into a sustainable tourist destination opening in 2030, with 40 new lodges, a hotel extension, restaurant, public sauna, pool house and event spaces – roughly 1,000 m² of new floor area on a site with close to zero current activity.
Tourism accounts for about 8% of global carbon emissions. Hotels in particular are intensive energy users: European hotels average 200–400 kWh/m²/year and generate 160–200 kg CO&sub2;/m². Finland’s cold climate (-20°C winters) makes heating the dominant load. Hylkysaari’s island geography adds further constraints: construction logistics are difficult, and grid connection resilience matters because external help during an outage is slow.
The research question was: which of three proposed pathways is the most techno-economically optimal for Hylkysaari, with respect to energy efficiency and sustainability?
KPIs
- KPI 1 – Nearly zero energy demand: minimise heating, cooling and electrical demand through efficiency measures. Measured in MWh/year.
- KPI 2 – Nearly total renewable energy supply: maximise local renewable generation and self-consumption to reduce grid dependence. Measured as % of total energy supply.
- KPI 3 – Nearly full waste heat recovery: recover and recirculate waste heat from saunas, laundry and kitchen. Measured in MWh/year and % of thermal demand.
Engineering contribution
- Designed the “Hylkysaari Vihreä Program” business model, covering the real-time energy dashboard, carbon offset scheme, value proposition, revenue streams and cost structure.
- Contributed to IDA ICE building energy modelling across all buildings and scenarios, including 3D building construction, parameter changes and simulation runs.
- Supported report revision and overall structure.
Scenarios
Each scenario is named after a Finnish wildflower to reflect its ambition level:
- Lily of the Valley (BAU): Insulation to Finnish building energy code only (U-wall 0.17 W/m²K, U-roof 0.09, U-window 1.0). Incandescent lighting at 60 W. No renewable generation or heat recovery. Benchmark for comparison.
- Golden Marguerite (Scenario 1): Insulation improved by 20% (U-wall 0.136, U-roof 0.072). Triple-glazed windows (U 0.8). LED lighting at 12 W with occupancy sensors cutting load by 22% during 11:00–17:00. Solar PV on hotel and lodge roofs. Waste heat recovery from hotel laundry and public sauna.
- Fireweed (Scenario 2): Insulation improved a further 20% (U-wall 0.109, U-roof 0.058). Same LED and occupancy sensor lighting as Scenario 1. Solar thermal collectors (70 m²/lodge, 160 m²/hotel) with thermal storage (400 L/lodge, 9,800 L/hotel) instead of PV. Waste heat recovery extended to restaurant kitchen in addition to laundry and sauna.
Modelling approach
IDA ICE modelled energy and heating demand for every building in every scenario. Each building was constructed in 3D from the provided floor plans. Parameters changed between scenarios were wall/roof insulation thickness, window type, lighting wattage, occupancy schedule savings factor, solar collector area and thermal storage volume. The simulation output hourly demand data that fed directly into HOMER PRO.
HOMER PRO received the hourly electrical and thermal load from IDA ICE and optimised the island microgrid. The grid was modelled with an emissions factor of 25 gCO&sub2;/kWh, power price of €0.24/kWh and sell-back of €0.10/kWh. District heating was approximated as a generic boiler at €90/MWh. Solar PV was sized across a search space of 0–400 kW with capital cost of €916.60/kW. Project lifetime 20 years, discount rate 6%, inflation 2%.
Excel handled waste heat recovery calculations and the full economic evaluation (NPV, BCR, DPP). Waste heat sources were the restaurant kitchen (dishwasher at 61°C and cooking exhaust at 70°C), hotel laundry (washer at 60°C and dryer at 90°C) and public sauna exhaust air at 80°C. A standard Q = VρcΔT heat exchanger model was used, with a 50°C return temperature throughout. The dryer contribution was taken as 40% of dryer energy consumption.
Waste heat recovery results
167 MWh/yearTotal recoverable waste heat across all sources
Hotel laundry110.6 MWh/year – largest single source (washer + dryer)
Kitchen55.9 MWh/year from dishwasher and cooking exhaust
The laundry washer alone contributes 79.4 MWh/year and the dryer 31.2 MWh/year. The restaurant kitchen dishwasher adds 18.9 MWh/year and cooking exhaust 37.1 MWh/year. The public sauna, while a symbolically important source, contributes only 0.5 MWh/year due to its intermittent use. Scenario 2 captures all sources; Scenario 1 excludes the kitchen.
KPI results
The table below summarises the modelled outcomes across all three scenarios:
BAU electricity324.98 MWhel/year — 939.17 MWhth/year thermal
S1 electricity183.52 MWhel/year — 659.22 MWhth/year thermal — 81.1% renewable
S2 thermal187.41 MWhel/year — 345.86 MWhth/year — 33.5% thermal renewable
Scenario 1 (Golden Marguerite) cuts electricity demand nearly in half versus BAU (183.52 vs 324.98 MWhel/year), primarily through LED lighting and occupancy sensors. Solar PV pushes the renewable electricity share from the grid baseline of 55% up to 81.1%. Thermal demand falls by 280 MWhth/year from improved insulation. Waste heat recovery captures 111.13 MWhth/year — 14.4% of annual thermal demand.
Scenario 2 (Fireweed) achieves the lowest thermal demand at 345.86 MWhth/year (versus 939.17 in BAU), driven by further insulation improvement and solar thermal collectors raising thermal renewable share to 33.5%. Waste heat recovery from the kitchen addition brings total recovery to 167.08 MWhth/year — 35% of annual thermal demand. Electricity demand is slightly higher than Scenario 1 (187.41 MWhel/year) due to auxiliary collector components.
Economic results
S1: DPP 6.5 yearsBCR 2.21 — NPV €0.72M — Total CAPEX €384k
S2: DPP 20 yearsBCR 1.0 — NPV €0.046M — Total CAPEX €546k
Solar collectors rejectedBenefits too low in Scandinavian climate to justify €395k cost
Golden Marguerite’s strong economics are driven by grid sell-back during peak PV production hours: with 400 kW installed (the HOMER PRO optimal), the scenario generates income that yields a BCR of 2.21 and pays back the €384k investment in 6.5 years. The solar PV capital cost of €916.60/kW is the single largest cost driver for Scenario 1.
Fireweed’s poor economics stem from the solar thermal collectors (€394.8k of the €546k total CAPEX). The thermal savings from replacing district heating with solar heat are insufficient in Helsinki’s cold, low-irradiance climate to cover that investment. DPP equals the 20-year project lifetime, meaning break-even only at the very end. The BCR of 1.0 confirms the investment is at the margin of viability.
Sensitivity analysis confirmed that Golden Marguerite’s NPC tracks directly with grid power price (higher prices improve the case), inversely with discount rate, and proportionally with PV capital cost — though even under pessimistic assumptions it outperforms Scenario 2.
Recommendation
No single scenario dominates all three KPIs. The recommended hybrid approach takes the solar PV from Scenario 1 (best for KPI 2 — 81.1% renewable electricity) and the deeper insulation, thermal storage and kitchen heat recovery from Scenario 2 (best for KPI 1 and KPI 3). This retains the economically sound PV investment while maximising energy demand reduction and waste heat capture across all three heat-intensive sources (laundry, sauna, kitchen). Solar thermal collectors are excluded on economic grounds.
Business model: Hylkysaari Vihreä Program
My contribution to the project was designing the guest-facing business model built around the island’s energy strategy. The Vihreä Program has two pillars:
- Real-time energy dashboard: guests see live data on the island’s energy consumption and renewable generation during their stay, creating awareness and encouraging conservation behaviour without requiring behavioural mandates.
- Carbon offset program: an opt-in scheme for guests to offset the residual footprint of their visit. Revenue is reinvested in island sustainability improvements, creating a visible link between guest engagement and environmental outcomes.
Target customer segments are environmentally conscious leisure travellers and corporate sustainability programs seeking credible destination partnerships. Revenue streams span premium sustainability-oriented bookings and the offset scheme. The cost structure is dominated by dashboard development, maintenance and offset verification infrastructure.
Limitations
- IDA ICE models individual building energy; system-level interactions between buildings were handled separately in HOMER PRO, introducing coupling assumptions.
- The Helsinki grid renewable fraction (55%) was assumed as a static average; future grid decarbonisation would improve all scenarios’ renewable KPI without design changes.
- Solar collector sizing was based on residential hot-water norms; hotel operational profiles may differ.
- Carbon offset verification requires third-party infrastructure not yet in place.