The problem
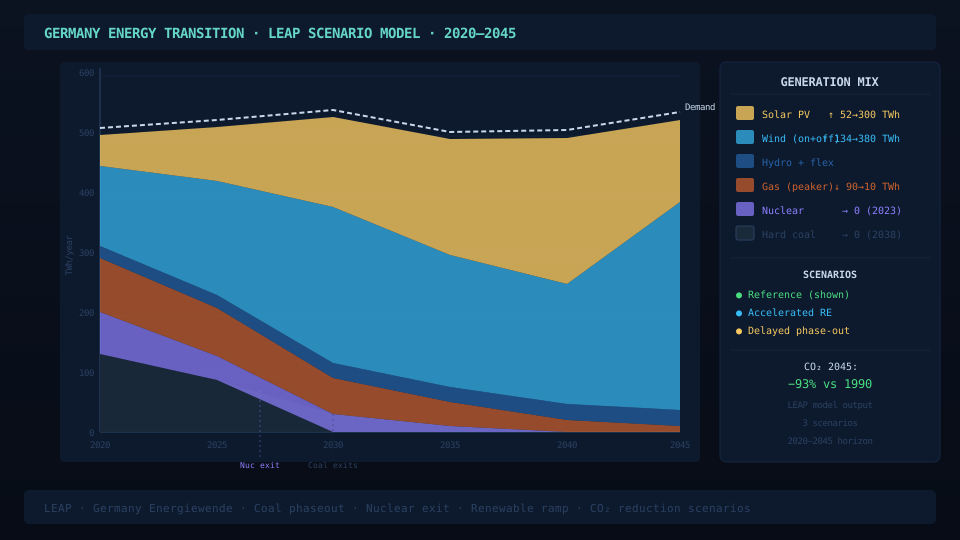
Germany is Europe’s largest economy (GDP $4.07 trillion, 2022) and its biggest CO&sub2; emitter — 675 million tonnes in 2021, of which electricity and heat accounted for 356 million tonnes (53%). Despite the Energiewende and the Federal Climate Change Act (climate neutrality by 2045, 80% renewable electricity by 2030), Germany is not on track. It has phased out nuclear, is expanding LNG infrastructure, and coal remained the largest single electricity source as recently as 2022 at 20.1% of generation.
The research question: would recommissioning recently decommissioned nuclear plants be more cost-efficient and bring Germany closer to its CO&sub2; reduction targets than following the existing NDC pathway?
2022 electricity baseline
Germany’s 2022 gross electricity production was 571.3 billion kWh. The mix that the model had to project forward:
- Lignite: 116.2 billion kWh (20.1%) — the largest fossil source
- Natural gas: 79.8 billion kWh (13.8%)
- Nuclear: 34.7 billion kWh (6.0%) — last plants closed April 2023
- Wind: 125.3 billion kWh (21.7%)
- Photovoltaic: 60.8 billion kWh (10.5%)
- Biomass: 44.6 billion kWh (7.7%)
- Renewables total: 254.0 billion kWh (44.4%)
Reaching 80% renewable electricity by 2030 from a 44% base in 2022, while simultaneously phasing out nuclear, required a massive and rapid build-out of wind and solar — a pace Germany was not achieving as of the modelling baseline.
Engineering contribution
- Built the Sankey diagram of Germany’s 2020 electricity flows from IEA data for the background section, visualising the 273,960 TJ export position and sectoral end-use split (industry 37.4%, residential 22.8%, commercial 22.8%).
- Analysed SDG 7.1 access and energy poverty risks under Germany’s decarbonisation trajectory, including the role of the EEG surcharge exemptions and the Energiewende’s community energy provisions in preventing “technology poverty”.
- Documented the perspective of German officials on sustainable development through Germany’s 2021 Voluntary National Review to the UN High Level Political Forum.
- Contributed charts and figures throughout the report.
LEAP model structure
The model has four branches: Key Assumptions, Demand, Transformation, and Resources. Electricity is the sole energy carrier across all demand sub-branches. The transformation sector covers Transmission and Distribution (losses starting at 5%, reducing to 3.5% by 2045) and Electricity Generation (11 aggregated technology processes). Shortfall is handled by imports.
Key assumptions: industry demand +1.3%/yr (GDP growth rate); household demand −0.6%/yr (falling household count + efficiency gains); population −0.525%/yr; income +1.5%/yr; household size 2 persons. Transport modelled explicitly with EVs growing from 1.04 million (2022) to 15 million (2030) to 25 million (2045); rail electrification from 54% to 95% of network by 2045.
Technology parameters (11 generation types)
All 11 technologies were parameterised from industry and literature sources with capacity, fuel cost, efficiency, availability, lifetime, CAPEX and O&M:
- Coal bituminous (19,010 MW): $4.98/GJ fuel, 30% efficiency, $2,081M/GW CAPEX, $24.44M/GW/yr O&M — highest CO&sub2; contributor
- Coal lignite (18,670 MW): $8.95/GJ, 30% efficiency, $2,170M/GW CAPEX — phased out by 2038
- Natural gas (34,250 MW): $35.56/GJ, 30% efficiency, $1,200M/GW CAPEX — NDC scenario relies on imports post-2038
- Nuclear (4,060 MW existing; +12,074 MW recommissioned in own scenario): $0.13/GJ fuel, 80% efficiency, 95.4% capacity factor, 50yr lifetime, $2,800M/GW CAPEX, $109.52M/GW/yr O&M — high CAPEX but near-zero fuel cost and zero direct CO&sub2;
- Solar (65,000 MW): $1,400M/GW CAPEX, 25yr lifetime, zero fuel cost
- Wind (66,200 MW): $2,000M/GW CAPEX, 25yr lifetime, 24% CF
- Hydro (14,500 MW): $7,000M/GW CAPEX, 70yr lifetime, 33% CF
- Biomass (8,910 MW): $4,756M/GW CAPEX, 35% efficiency, 53% CF
- Geothermal (500 MW): $4,198M/GW CAPEX, 63% CF
- Municipal solid waste (1,068 MW): $24,000M/GW CAPEX — highest capital cost per GW
Nuclear’s merit order was adjusted to 2 (ahead of oil) in the own scenario to facilitate dispatch between 2024 and 2038, aligning with the government’s commitment to retire coal and oil by 2038.
Nuclear recommissioning scenario
The own scenario recommissions eleven plants decommissioned within the last five years, adding approximately 12.074 GW of capacity. The targeted plants include Brokdorf (1,410 MW, shut 2021), Grohnde (1,360 MW, shut 2021), Gundremmingen B (1,284 MW, shut 2017), Gundremmingen C (1,288 MW, shut 2021), Emsland (1,335 MW, shut April 2023), Isar 2 (1,410 MW, shut April 2023) and Neckarwestheim 2 (1,310 MW, shut April 2023).
Demand projections by sector
Total 2045: 2,488 million GJ+42% from 1,742 million GJ in 2022
Transport: 53 → 365 million GJ+587% driven by EV and rail electrification
Industry: 729 → 981 million GJ+34% on GDP-linked 1.3%/yr growth
Households fall from 503 to 419 million GJ as household numbers shrink and efficiency improves. Commercial grows from 457 to 723 million GJ. Transport is the fastest-growing sector by far, as electrification of road vehicles and rail absorbs a large share of new electricity demand.
Key results
14% nuclear share (2045)Own scenario — up from 0% in 2023 and 6.1% in 2022
Near-zero electricity CO&sub2;Own scenario by 2045 vs. continued gas reliance in NDC
+2.21% social costNuclear scenario premium over NDC by 2045
Coal was the largest CO&sub2; source in 2022 at 270 million metric tonnes. Both scenarios show declining coal emissions as plants retire by 2038. The divergence comes after 2038: the NDC scenario fills the gap with imported natural gas, keeping emissions non-zero; the own scenario fills it with nuclear and renewables, driving electricity-sector CO&sub2; to near zero.
The social cost premium of the nuclear scenario (+2.21% by 2045) is driven primarily by nuclear’s higher CAPEX ($2,800M/GW vs. $1,200M/GW for gas) and O&M ($109.52M/GW/yr). Solar and wind remain the largest social cost contributors in both scenarios due to their scale of deployment. The NDC scenario avoids the nuclear CAPEX but incurs ongoing high fuel costs from gas imports — increasingly from Russia’s neighbours post-Ukraine invasion — which are price-exposed and carbon-intensive.
On SDG 7 and energy poverty: Germany’s decarbonisation path risks “technology poverty” as consumers face mandates to upgrade end-use equipment. The EEG surcharge exemptions for renewable self-supply and the Energiewende’s community energy provisions partially mitigate this, but the transition’s distributional impacts require continued policy attention.
Policy context
Five key policies frame the scenarios: the Federal Climate Change Act (2019 — climate neutrality 2045, negative emissions 2050); the Easter Package (2022 — accelerated renewable permitting); the Climate Action Program 2030 (2019 — CO&sub2; pricing for transport and heat, coal phase-out 2038); the Renewable Energy Sources Act (2000 — 80% renewable electricity by 2030); and the Energy Efficiency Strategy 2050 (2019 — 30% lower consumption by 2030 vs 2008). As of 2022, only 56.9% of Germany’s SDG targets were achieved or on track; 34.7% were worsening.
Limitations
- Nuclear waste disposal costs not included — adding them would increase the own scenario’s social cost premium.
- Technologies represented as aggregated capacity blocks rather than individual plants due to data availability.
- Heating sector electrification out of scope — identified as future work.
- Start year of 2023 chosen to avoid COVID and Ukraine price distortions in the baseline.