← Back to portfolio

Energy KPIs · ISO 50001 · Reporting

Industrial Energy KPI Toolkit

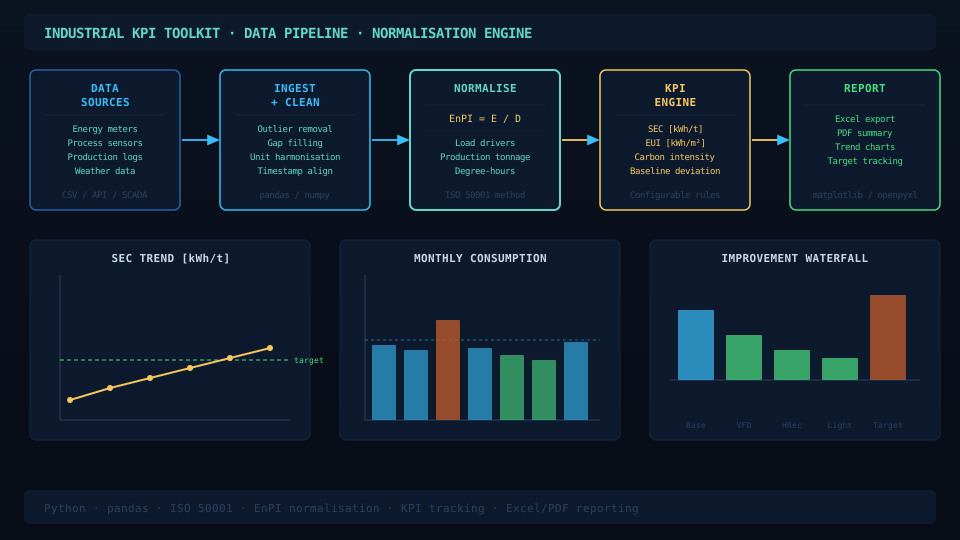
A Python, Excel and Streamlit toolkit for industrial energy KPIs, EnPI normalisation, anomaly flags, action tracking and management reporting.

Industrial energy KPI and normalisation dashboard visual

What I built

  • Created an Excel template and Python runner for repeatable industrial KPI reporting.
  • Implemented driver-based baseline normalisation using production and operating-hours assumptions.
  • Added missing-data, residual-anomaly and drift-hint flags for energy-management review.
  • Built a Streamlit dashboard with guided upload/configure/review/export workflow.

Method

EnPI normalisation workflow

  1. Ingest: read monthly utility data (electricity, gas, steam, compressed air) plus production volumes and operating hours from an Excel workbook (one row per period, one column per stream).
  2. Baseline regression: fit E = a + b·P + c·HDD on the baseline window (typically 12 prior months), where P is production and HDD is heating-degree-days for climate-driven loads. Residuals flag drift from the baseline relationship.
  3. Normalise: compute EnPI = E_actual / E_baseline (relative) and the absolute EnPI = E / P (kWh/unit). ISO 50006:2014 framing throughout.
  4. Diagnose: flag rows where |residual| > 2σ (anomaly) or where the trailing-3-month residual mean is monotonic (drift).
  5. Report: Streamlit dashboard for review, plus a one-page PDF with chart + commentary box for management circulation.

Outputs

What the tool produces

  • results.csv — period-by-period EnPI, residual, anomaly flag, drift flag
  • actions.csv — auto-generated when a residual exceeds threshold, with assignee placeholder and 4-week follow-up date
  • plots/ — baseline scatter with current point highlighted, residual time-series with control limits, EnPI control chart
  • updated_workbook.xlsx — original input with added results columns and chart sheets
  • monthly_report.pdf — single page: headline EnPI, change vs. previous period, top 3 anomalies, suggested next actions

Limitations

What the tool does not do

  • Does not perform measurement-and-verification (M&V) to IPMVP Option C; the regression is a screening EnPI baseline, not a savings-verification protocol.
  • Does not handle sub-metering hierarchies — it assumes a single aggregate meter per stream. Sites with parallel metering need a pre-aggregation step.
  • The anomaly threshold (2σ) is a stand-in; production sites should calibrate to historical false-positive rate during the first 3 months of use.
  • No automated bill-data ingestion — utility bills must be transcribed or exported to the workbook template manually.

Relevance

Why this matters

This project turns ISO 50001-style energy-performance tracking into a practical workflow: structured inputs, transparent baseline assumptions, diagnostics, action ownership and management-ready reporting. It directly supports the industrial-energy/decarbonisation track positioning by demonstrating reproducible, audit-friendly EnPI tooling that an ISO 50001 lead auditor or an energy-coordinator role can recognise.