Experimental setup
The M-TES unit was characterised during discharge using two thermostatic oil baths regulating the HTF temperature, a coil heat exchanger (HX), an HTF reservoir and pump with frequency controller. Ten PT100 sensors (Chn 201–210) monitored temperatures along the M-TES unit from inlet (201) to outlet (210); a type-T thermocouple tracked the HTF reservoir buffer temperature (Chn 115). Data was logged via a Keithley acquisition system at 10-second intervals.
Cooling was provided by a cold water faucet when buffer tank temperature fell below 100°C, enabling controlled heat discharge. Flow was measured by an Omega flow meter.
PCM and HTF physical parameters
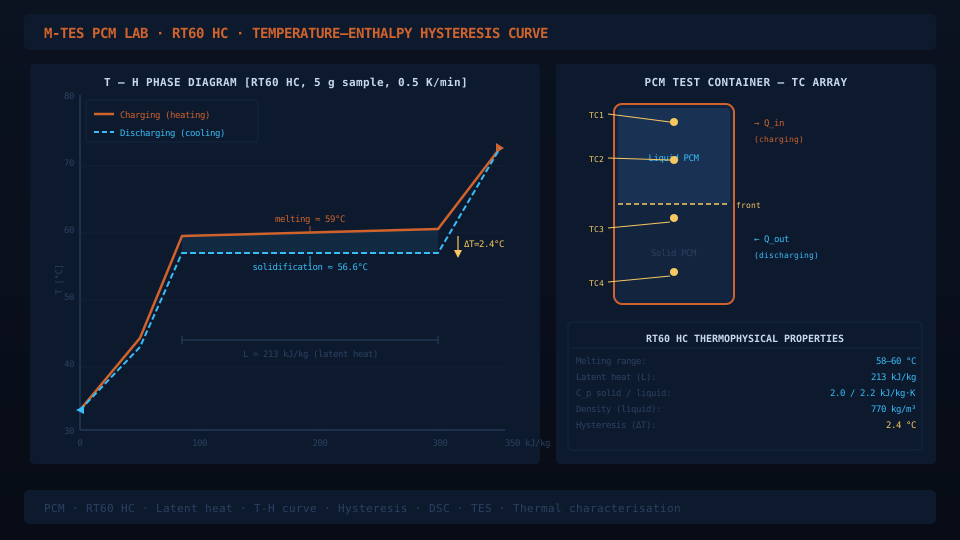
- PCM — RT60 HC: phase change 60°C (solidification 62→51°C); density 0.75 kg/L (liquid) / 0.85 kg/L (solid); Cp = 2 kJ/(kg·K); latent heat 264.5 kJ/kg; total volume 44 L → mass 33 kg
- HTF — RENOLIN THERM 300X: density 875 kg/m³ at 15°C; Cp = 2 kJ/(kg·K) at 50°C (temperature-dependent); flow rate 2 L/min = 3.33×10³ m³/s
- Tank: stainless steel shell, 150 kg, Cp assumed 0.5 kJ/(kg·K)
Theoretical storage capacity
Three heat contributions were calculated for the discharge window (71.1°C → 40.1°C):
Total theoretical storage capacity: 10,049.2 kJ — latent heat accounts for 86.9% of the total, confirming the dominance of phase-change over sensible contributions in this operating window.
Sensor temperature behaviour
Key observations from the 10-sensor temperature-vs-time plot over 8 hours:
- Inlet (Chn 201) drops first and most sharply — HTF entering at the lower oil-bath temperature drives the discharge front from the inlet.
- Outlet (Chn 202) decreases steadily throughout, unlike all other sensors, reflecting integrated heat extraction across the unit.
- Sensor pairs 203–204, 205–206, 207–208, 209–210 follow a stepped pattern: each pair drops sequentially with approximately 40-minute intervals, indicating a thermal front propagating through the PCM from inlet to outlet.
- A sudden drop in the oil reservoir Chn 115 temperature was identified as a likely measurement error.
- At 8 hours, all sensors converge to 40°C — confirming full thermal equilibration with the oil bath temperature and complete discharge.
Experimental heat transfer — three methods
Heat transferred from PCM to HTF was calculated by integrating the inlet–outlet temperature difference over the 10-second timestep sequence:
QHTF = Σ Cp,HTF × ΔT × V̇ × ρ × Δt, where ΔT = TChn202 − TChn201
- Method 1 (temperature-dependent ρ and Cp): Density and Cp varied with temperature using datasheet curves. Cp,HTF decreased from 2.033 to 1.945 kJ/(kg·K); ρ increased from 839.6 to 854.9 kg/m³ during the experiment. QHTF = 10,035.6 kJ
- Method 2 (constant ρ = 825 kg/m³, Cp = 2 kJ/(kg·K)): QHTF = 9,814.6 kJ
- Method 3 (including tank heat absorption): Qtank = 150 × 0.5 × 30 = 2,250 kJ. Total: 12,285.6 kJ (Method 1 + tank) or 12,064.6 kJ (Method 2 + tank)
Theory vs experiment comparison
Method 1 (variable properties) achieves 99.9% agreement with theory when comparing PCM-only contributions. This close match validates the theoretical model and confirms the sensor arrangement and integration approach are accurate.
The Method 3 values (12,064–12,286 kJ) exceed theoretical predictions because the stainless-steel tank absorbs 2,250 kJ of heat not included in the PCM-focused theoretical model. This is the largest identified discrepancy source, not measurement error. Minor additional contributors include heat losses to the environment and 10-second data-logging resolution.
Limitations and future work
- Theoretical model does not account for tank heat absorption — including it would close the Method 3 gap.
- Density and Cp functions were digitised from datasheet plots rather than tabular data; minor digitisation errors may affect Method 1 accuracy.
- Single test run — repeated charge/discharge cycling would quantify PCM stability and degradation.
- Only discharge characterised; a charge experiment under equivalent conditions would complete the round-trip efficiency picture.
- No heat loss correction applied — adding insulation sensors or using a heat-loss model would improve the energy balance closure.