← Back to portfolio

Hydrogen · Offshore wind · Pyomo dispatch

PyNEXUS Green Hydrogen Network Model

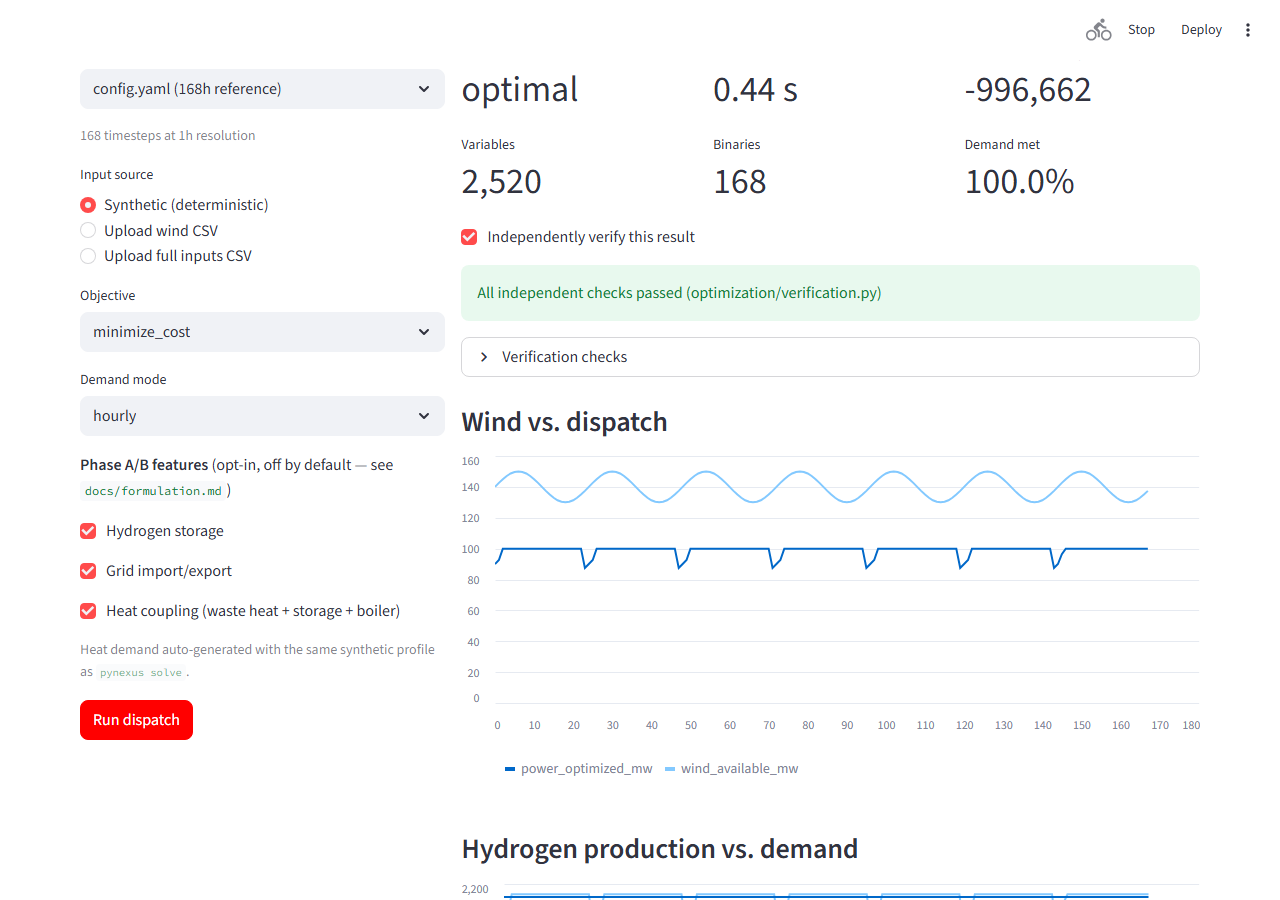
A coupled green-hydrogen asset model linking offshore wind generation, PEM electrolysis, hydrogen pipeline delivery and dispatch optimisation.

Green hydrogen wind electrolyzer and pipeline model visual

What I built

  • Implemented component models for offshore wind production, electrolyzer behaviour and hydrogen pipeline pressure/flow constraints.
  • Connected the components into a green-hydrogen asset workflow with hourly simulation and KPI reporting.
  • Built MILP dispatch optimisation to compare cost-minimising and emissions-aware operating strategies.
  • Centralised physical and economic assumptions in a configuration file for transparent scenario changes.

Method

Multi-vector network model

  1. Nodes: renewable generators (wind/solar with hourly capacity factors), electrolysers (PEM, η_LHV ≈ 0.62), storage (battery + hydrogen pressure vessel), and demand sinks (industrial offtake).
  2. Edges: electricity transmission (with stated capacity), hydrogen pipelines (with Weymouth-type pressure-drop constraints), road truck routes (cost per kg-km).
  3. Optimisation: mixed-integer linear program in PuLP — minimise total annualised cost subject to demand balance at every node every hour, asset capacities, ramp limits and storage state-of-charge constraints.
  4. Scenarios: three demand growth trajectories (low/central/high) × two policy backdrops (with/without H₂ price support) = 6 scenarios per network configuration.
  5. Outputs: dispatch time-series per asset, marginal cost shadow prices, build-out plan (when a new asset becomes economic), and a multi-network comparison dashboard.

Outputs

What the model produces

  • dispatch_hourly.csv — per-asset, per-hour generation/storage state and flows
  • marginal_prices.csv — shadow price at each node × hour (€/MWh_el and €/kg_H₂)
  • capacity_buildout.csv — when a new electrolyser/storage unit becomes part of the optimum
  • network_map.html — interactive Plotly map of nodes + flow widths
  • scenario_compare.pdf — total system cost, CO₂ avoided, and curtailment across the 6 scenarios

Limitations

What the model does not include

  • The electrolyser efficiency is constant at the LHV operating point — no part-load curve; real PEM efficiency drops noticeably below 30 % load.
  • Pipeline constraints use the Weymouth steady-state form. Transient gas dynamics (line-pack effects) are not modelled.
  • Truck logistics use a fixed €/kg-km — no time-dependent congestion or driver-availability modelling.
  • The scenario set is for illustration; investment decisions for a real network need a full Monte-Carlo over demand, price and CAPEX uncertainty.
  • Hydrogen end-use (e.g. steel-mill DRI reduction) is treated as a fixed offtake; cross-sectoral coupling would extend the model significantly.

Relevance

Why this matters

This project extends the energy-systems portfolio beyond electricity-only modelling into multi-vector infrastructure: renewable power, hydrogen production, pipeline constraints and optimisation-based operations. It transfers the MILP-dispatch logic from the district-heating case into a more complex multi-energy carrier setting — the same modelling discipline applied to a different boundary.