← Back to portfolio

Vibration · FFT/PSD · Python reports

Rotating Machinery Vibration Mini-Lab

A one-day vibration workflow using phone accelerometer data as a low-cost proxy for rotating-machinery diagnostics.

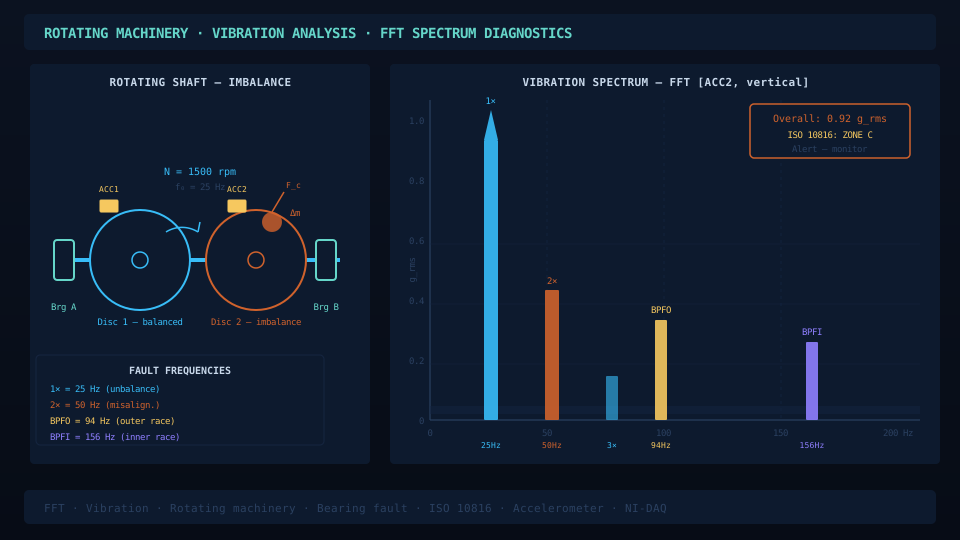
Rotating machinery vibration frequency analysis visual

What I built

  • Designed a reproducible mini-lab workflow for collecting and comparing vibration data at different operating points.
  • Implemented filtering, rolling RMS, FFT/PSD overlays and spectrogram generation.
  • Packaged results into a plain-English HTML report and spreadsheet-friendly summary metrics.
  • Documented limitations around sampling frequency, aliasing and industrial sensor differences.

Method

From phone accelerometer to FFT/PSD

  1. Sensor mount: phone fixed rigidly to the housing of a small rotating device (PC fan, drill). Phyphox records 3-axis acceleration at f_s ≈ 100 Hz (Nyquist 50 Hz, sufficient for low-RPM screening).
  2. Data acquisition: capture 60–120 s windows at three operating points (idle, nominal, loaded). Export to CSV with timestamps.
  3. Pre-processing: mean-removal, optional high-pass at 2 Hz to reject postural drift, then a Hann window before FFT.
  4. Spectra: Welch PSD with 50 % overlap and 4096-point segments. Identify the rotational fundamental f_r = RPM/60 and its first 5 harmonics.
  5. Spectrograms: 256-sample STFT to show whether spectral content drifts during a run (a soft proxy for unbalance development or thermal-growth effects).
  6. Report: bundled HTML with overlays of the three operating points, harmonic table and engineering commentary on what the spectral shape means.

Outputs

What the mini-lab produces

  • time_traces.png — three-axis acceleration vs. time for each operating point, with RMS envelope overlay
  • fft_overlay.png — Welch PSD overlay (idle / nominal / loaded) on a log-frequency axis, harmonics marked
  • spectrogram_per_run.png — STFT heatmap with rotational fundamental and harmonics annotated
  • summary_metrics.csv — RMS, peak, crest factor, dominant frequency, harmonic ratios per run
  • report.html — single-file deliverable with charts, tables and an engineering note on aliasing risk and what a real industrial accelerometer (4–10 kHz BW) would add

Limitations

What a phone sensor cannot do

  • Bandwidth: phone IMUs are typically 100 Hz; bearing-fault frequencies (BPFO/BPFI) for industrial machinery sit at 5–20 kHz and are completely missed.
  • Aliasing: any spectral content above 50 Hz folds back into the captured band — interpretations above 30 Hz should be treated as unreliable.
  • Calibration: no traceable mV/g reference — amplitudes are relative, not engineering-unit-correct.
  • Mounting: housing-coupled, not directly on the bearing — high-frequency transmission path is heavily attenuated.
  • The workflow is therefore a SCREENING tool for shape/trending, not a condition-monitoring system. The portfolio explicitly flags this.

Relevance

Why this matters

This project demonstrates practical signal-processing judgement: turning raw sensor data into interpretable frequency fingerprints while clearly communicating measurement-chain limitations. The same RMS → FFT → harmonics → spectrogram pipeline transfers directly to NI-DAQ/LabVIEW data from the Siemens thesis rig, with the added rigor of calibrated industrial sensors.